
Annex A
Demographic indicators and social, economic and cultural indicators
Demographic indicators and social, economic and cultural indicators
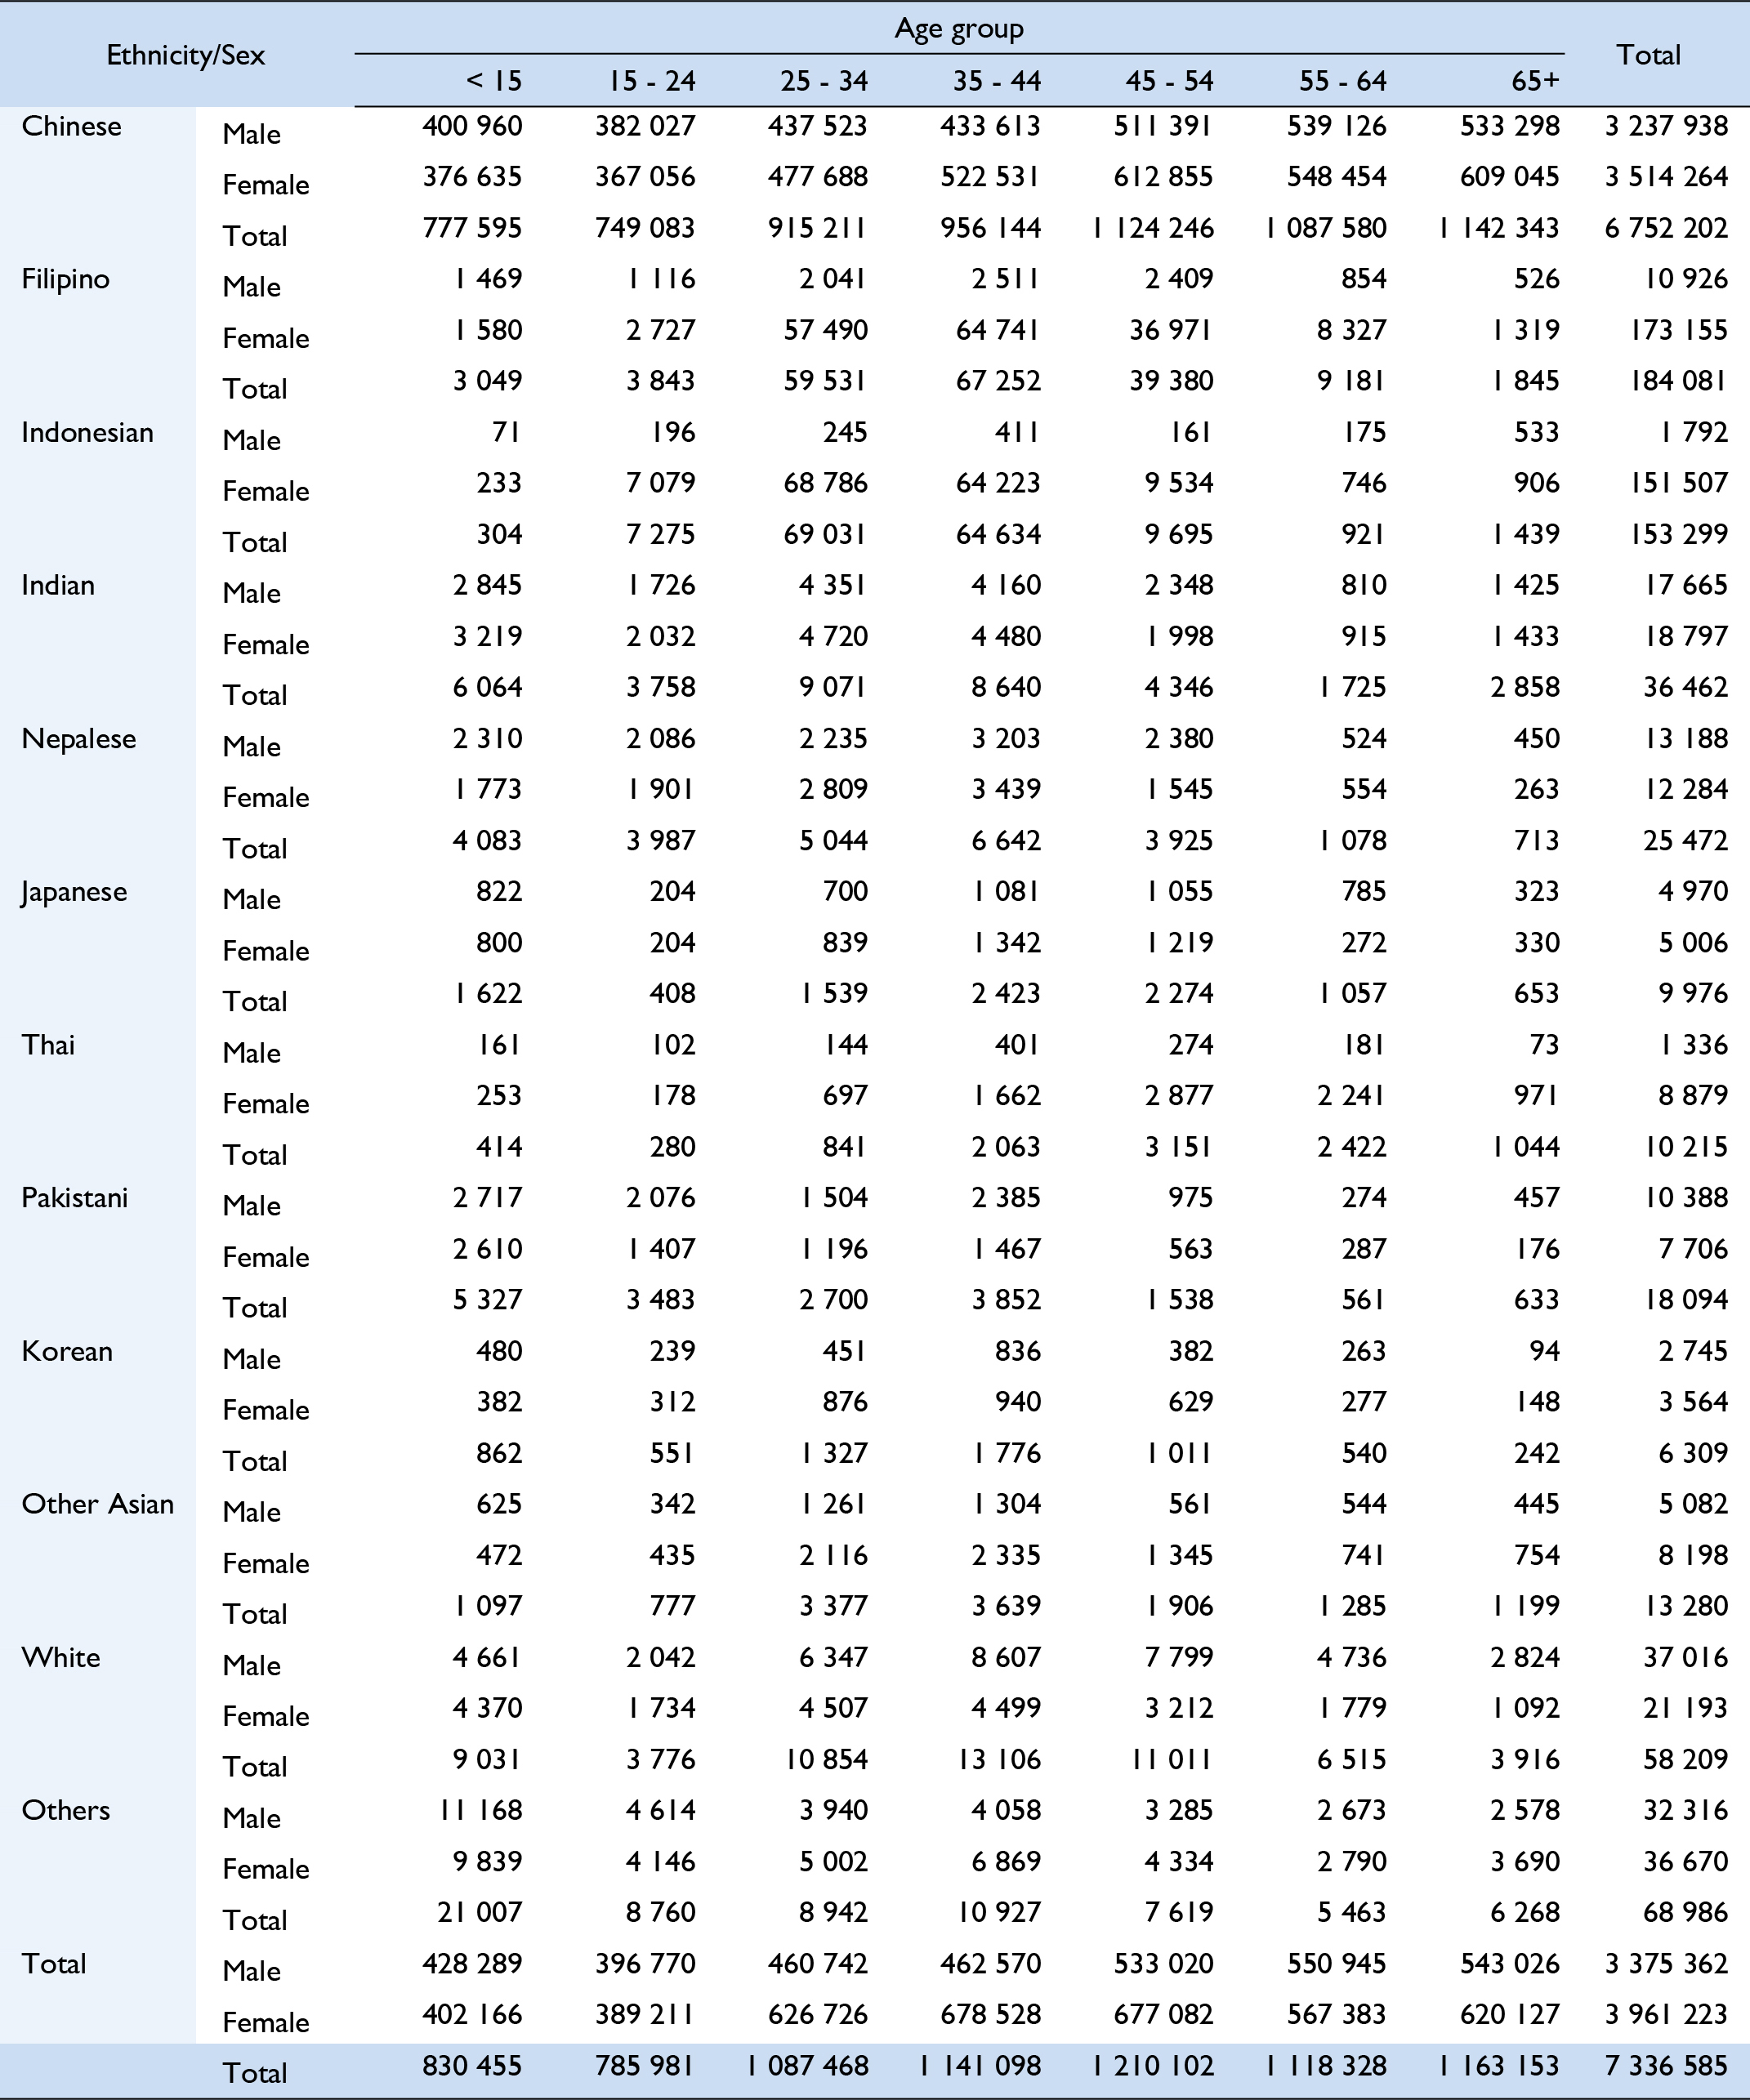
Note: The 2016 Population By-census conducted from June to August 2016 provides a benchmark for revising the population figures compiled since the 2011 Population Census. In the above table, figures from 2012 to 2015 have been revised accordingly.
Note: The 2016 Population By-census conducted from June to August 2016 provides a benchmark for revising the population figures compiled since the 2011 Population Census. In the above table, figures from 2012 to 2015 have been revised accordingly.
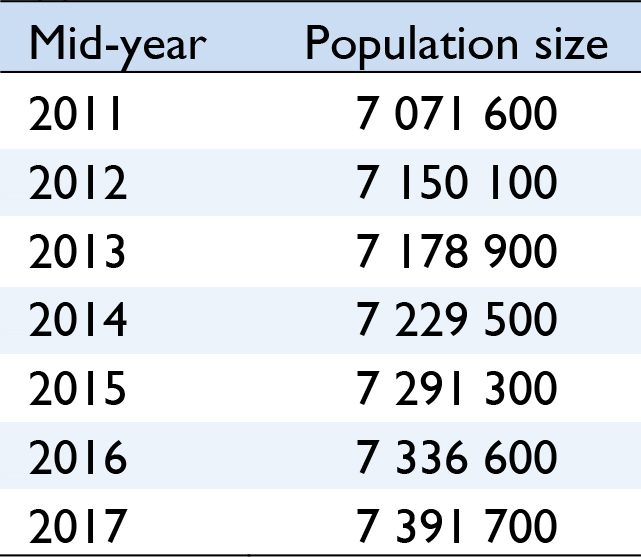
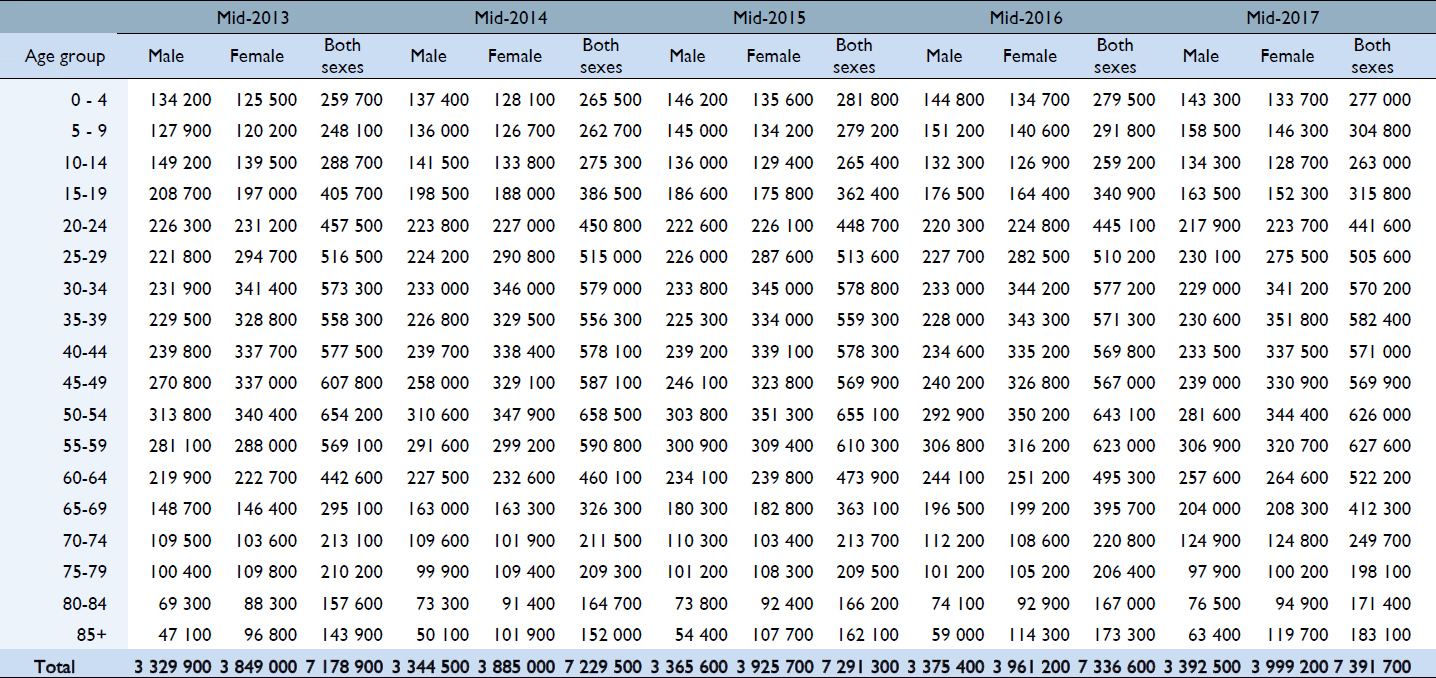
Notes: Figures refer to end-June of the year.
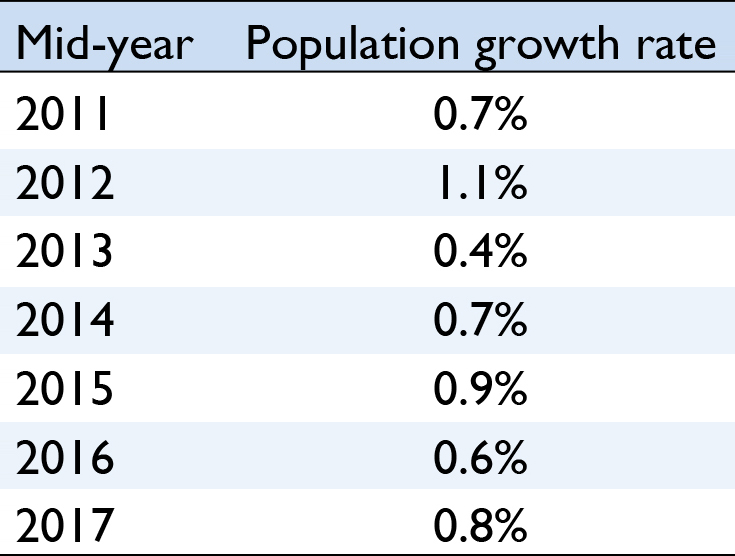
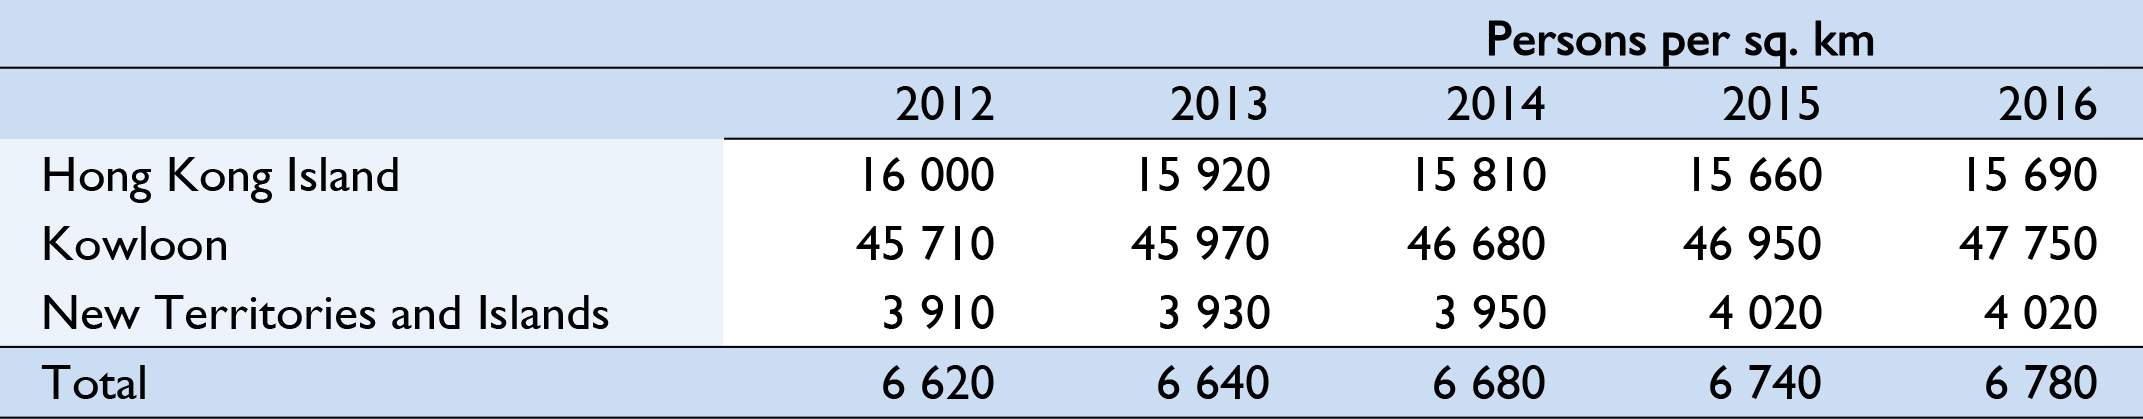
The 2016 Population By-census conducted from June to August 2016 provides a benchmark for revising the population figures compiled since the 2011 Population Census. In the above table, figures from 2012 to 2015 have been revised accordingly.
Note: The figures exclude mute persons.
Note: The 2016 Population By-census conducted from June to August 2016 provides a benchmark for revising the population figures compiled since the 2011 Population Census. In the above table, figures from mid-2013 to mid-2015 have been revised accordingly.
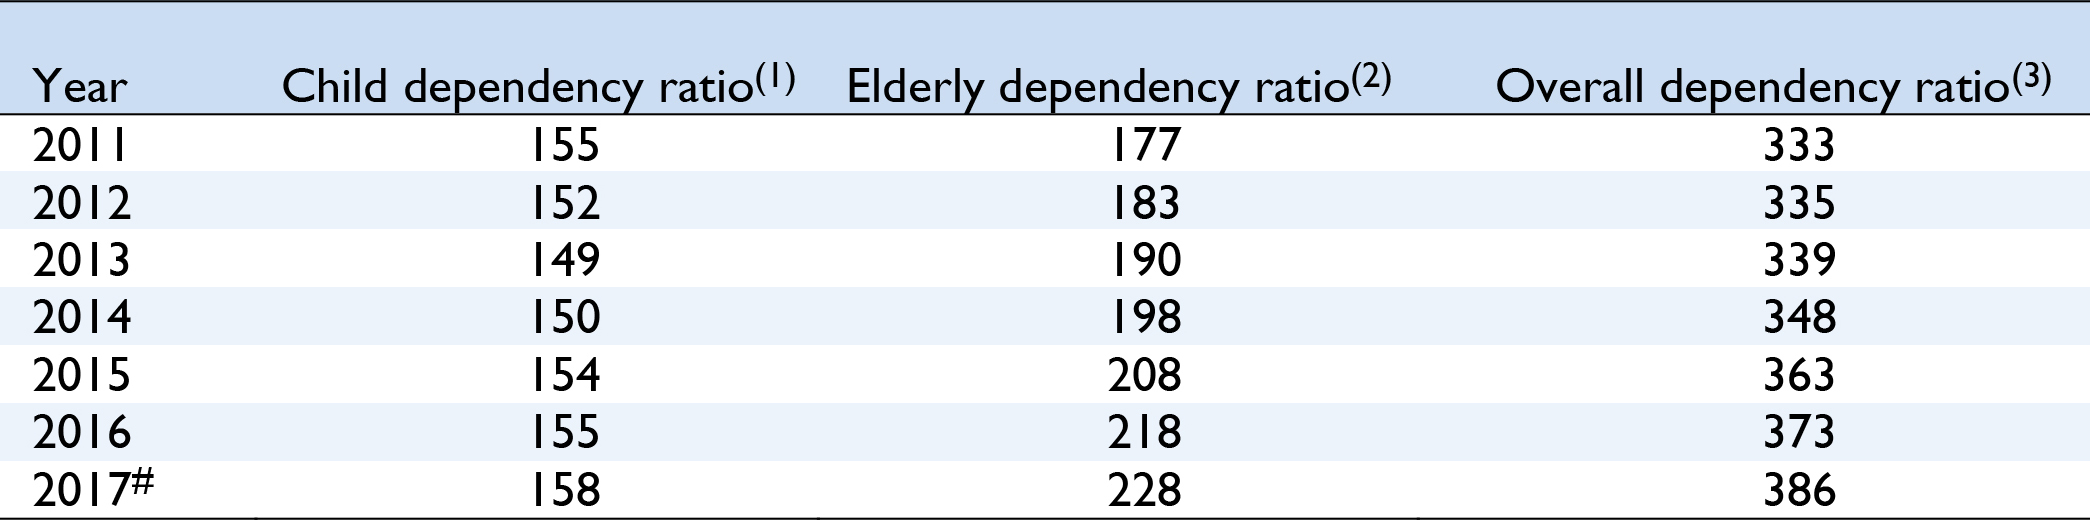
Note:
(1) The number of persons aged under 15 per 1 000 persons aged between 15 and 64.
(2) The number of persons aged 65 and over per 1 000 persons aged between 15 and 64.
(3) The number of persons aged under 15 and aged 65 and over per 1 000 persons aged between 15 and 64.
The 2016 Population By-census conducted from June to August 2016 provides a benchmark for revising the population figures compiled since the 2011 Population Census. In the above table, figures from 2012 to 2015 have been revised accordingly.
Note: The 2016 Population By-census conducted from June to August 2016 provides a benchmark for revising the population figures compiled since the 2011 Population Census. In the above table, population-related figures from 2012 to 2015 have been revised accordingly.


Note: The 2016 Population By-census conducted from June to August 2016 provides a benchmark for revising the population figures compiled since the 2011 Population Census. In the above table, population-related figures from 2012 to 2015 have been revised accordingly.

Note: The 2016 Population By-census conducted from June to August 2016 provides a benchmark for revising the population figures compiled since the 2011 Population Census. In the above table, population-related figures from 2012 to 2015 have been revised accordingly.

Note: The 2016 Population By-census conducted from June to August 2016 provides a benchmark for revising the population figures compiled since the 2011 Population Census. In the above table, population-related figures from 2012 to 2015 have been revised accordingly.


Note:
(1) Single parents are defined as mothers or fathers who are never married, widowed, divorced or separated, and living with child(ren) aged under 18 in the same household in the 2011 Population Census. Figures for 2001 and 2006 have been re-compiled based on the above definition of single parents.
(2) The figures of the 2006 Population By-census include 975 971 domestic households with female household head. Among them, there were 332 402 domestic households reported to have more than one household head and at least one female head.
(3) The figures of the 2011 Population Census include 1 078 228 domestic households with female household head. Among them, there were 300 329 domestic households reported to have more than one household head and at least one female head.

Note: (1) Refers to “Health” and “Education” under the Classification of Individual Consumption According to Purpose. “Health” covers expenditure on outpatient and hospital services, proprietary medicines and supplies, and medical and health equipment. “Education” covers school fees (but excluding those for interest and sports courses) and expenditure on other educational services.


Note: (1) Underweight was defined as body weight less than the 2 standard deviations below the median weight for age on the World Health Organization 2006 child growth standard. Data was based on the clinical information of children born in (2) 2014 (body weight in 6 to 24 months) and (3) 2010 (48 to 60 months).

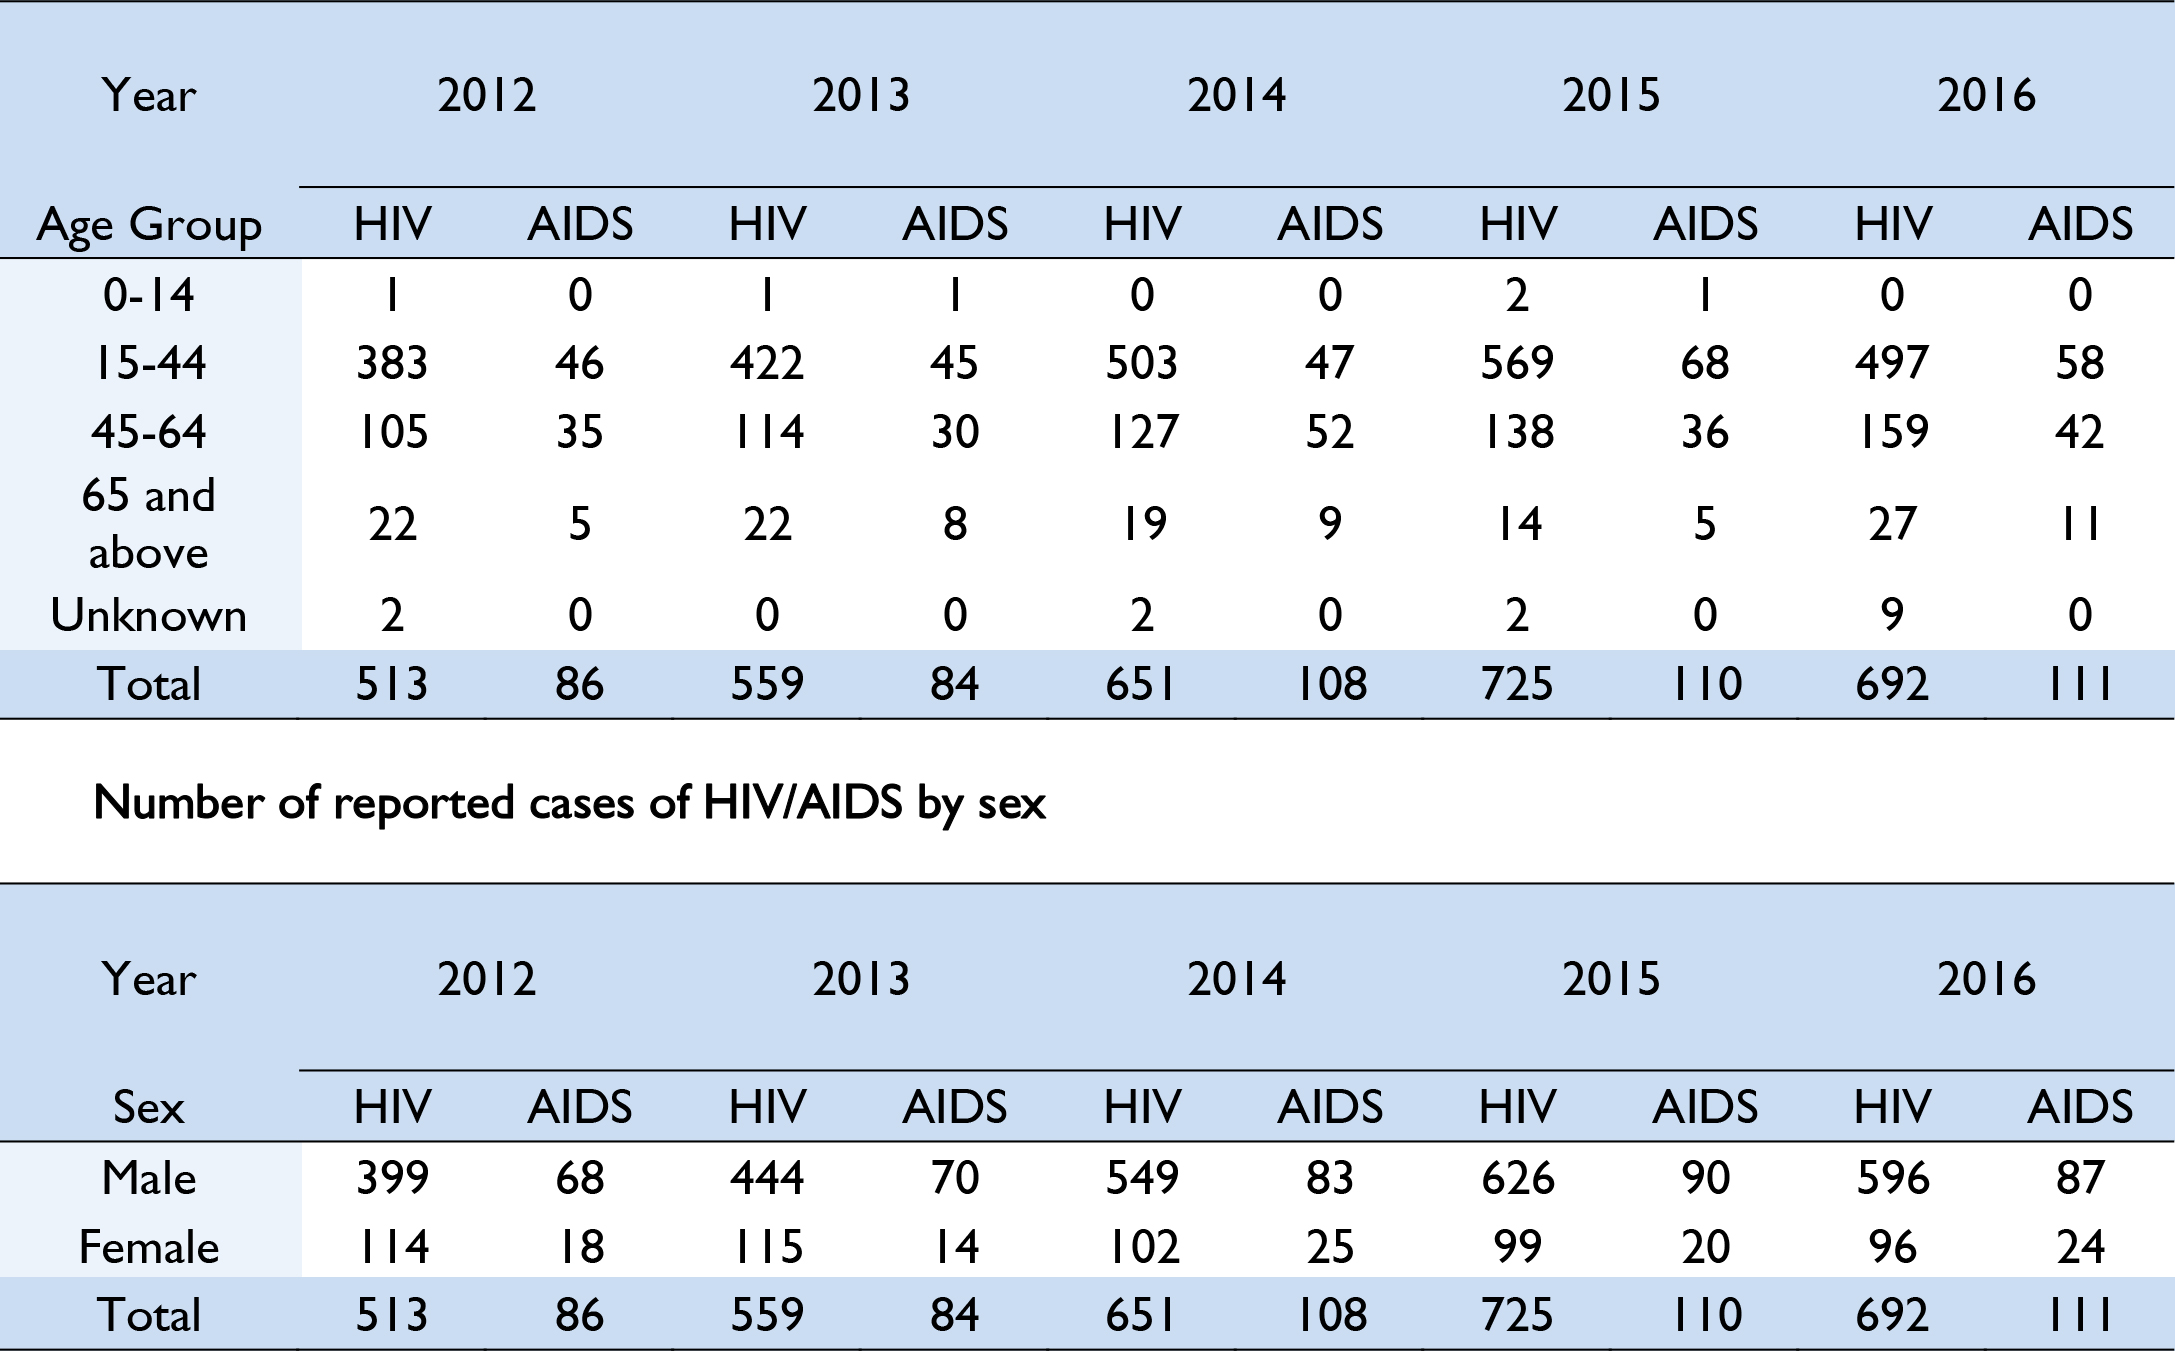
Note: *Total includes unknown sex.
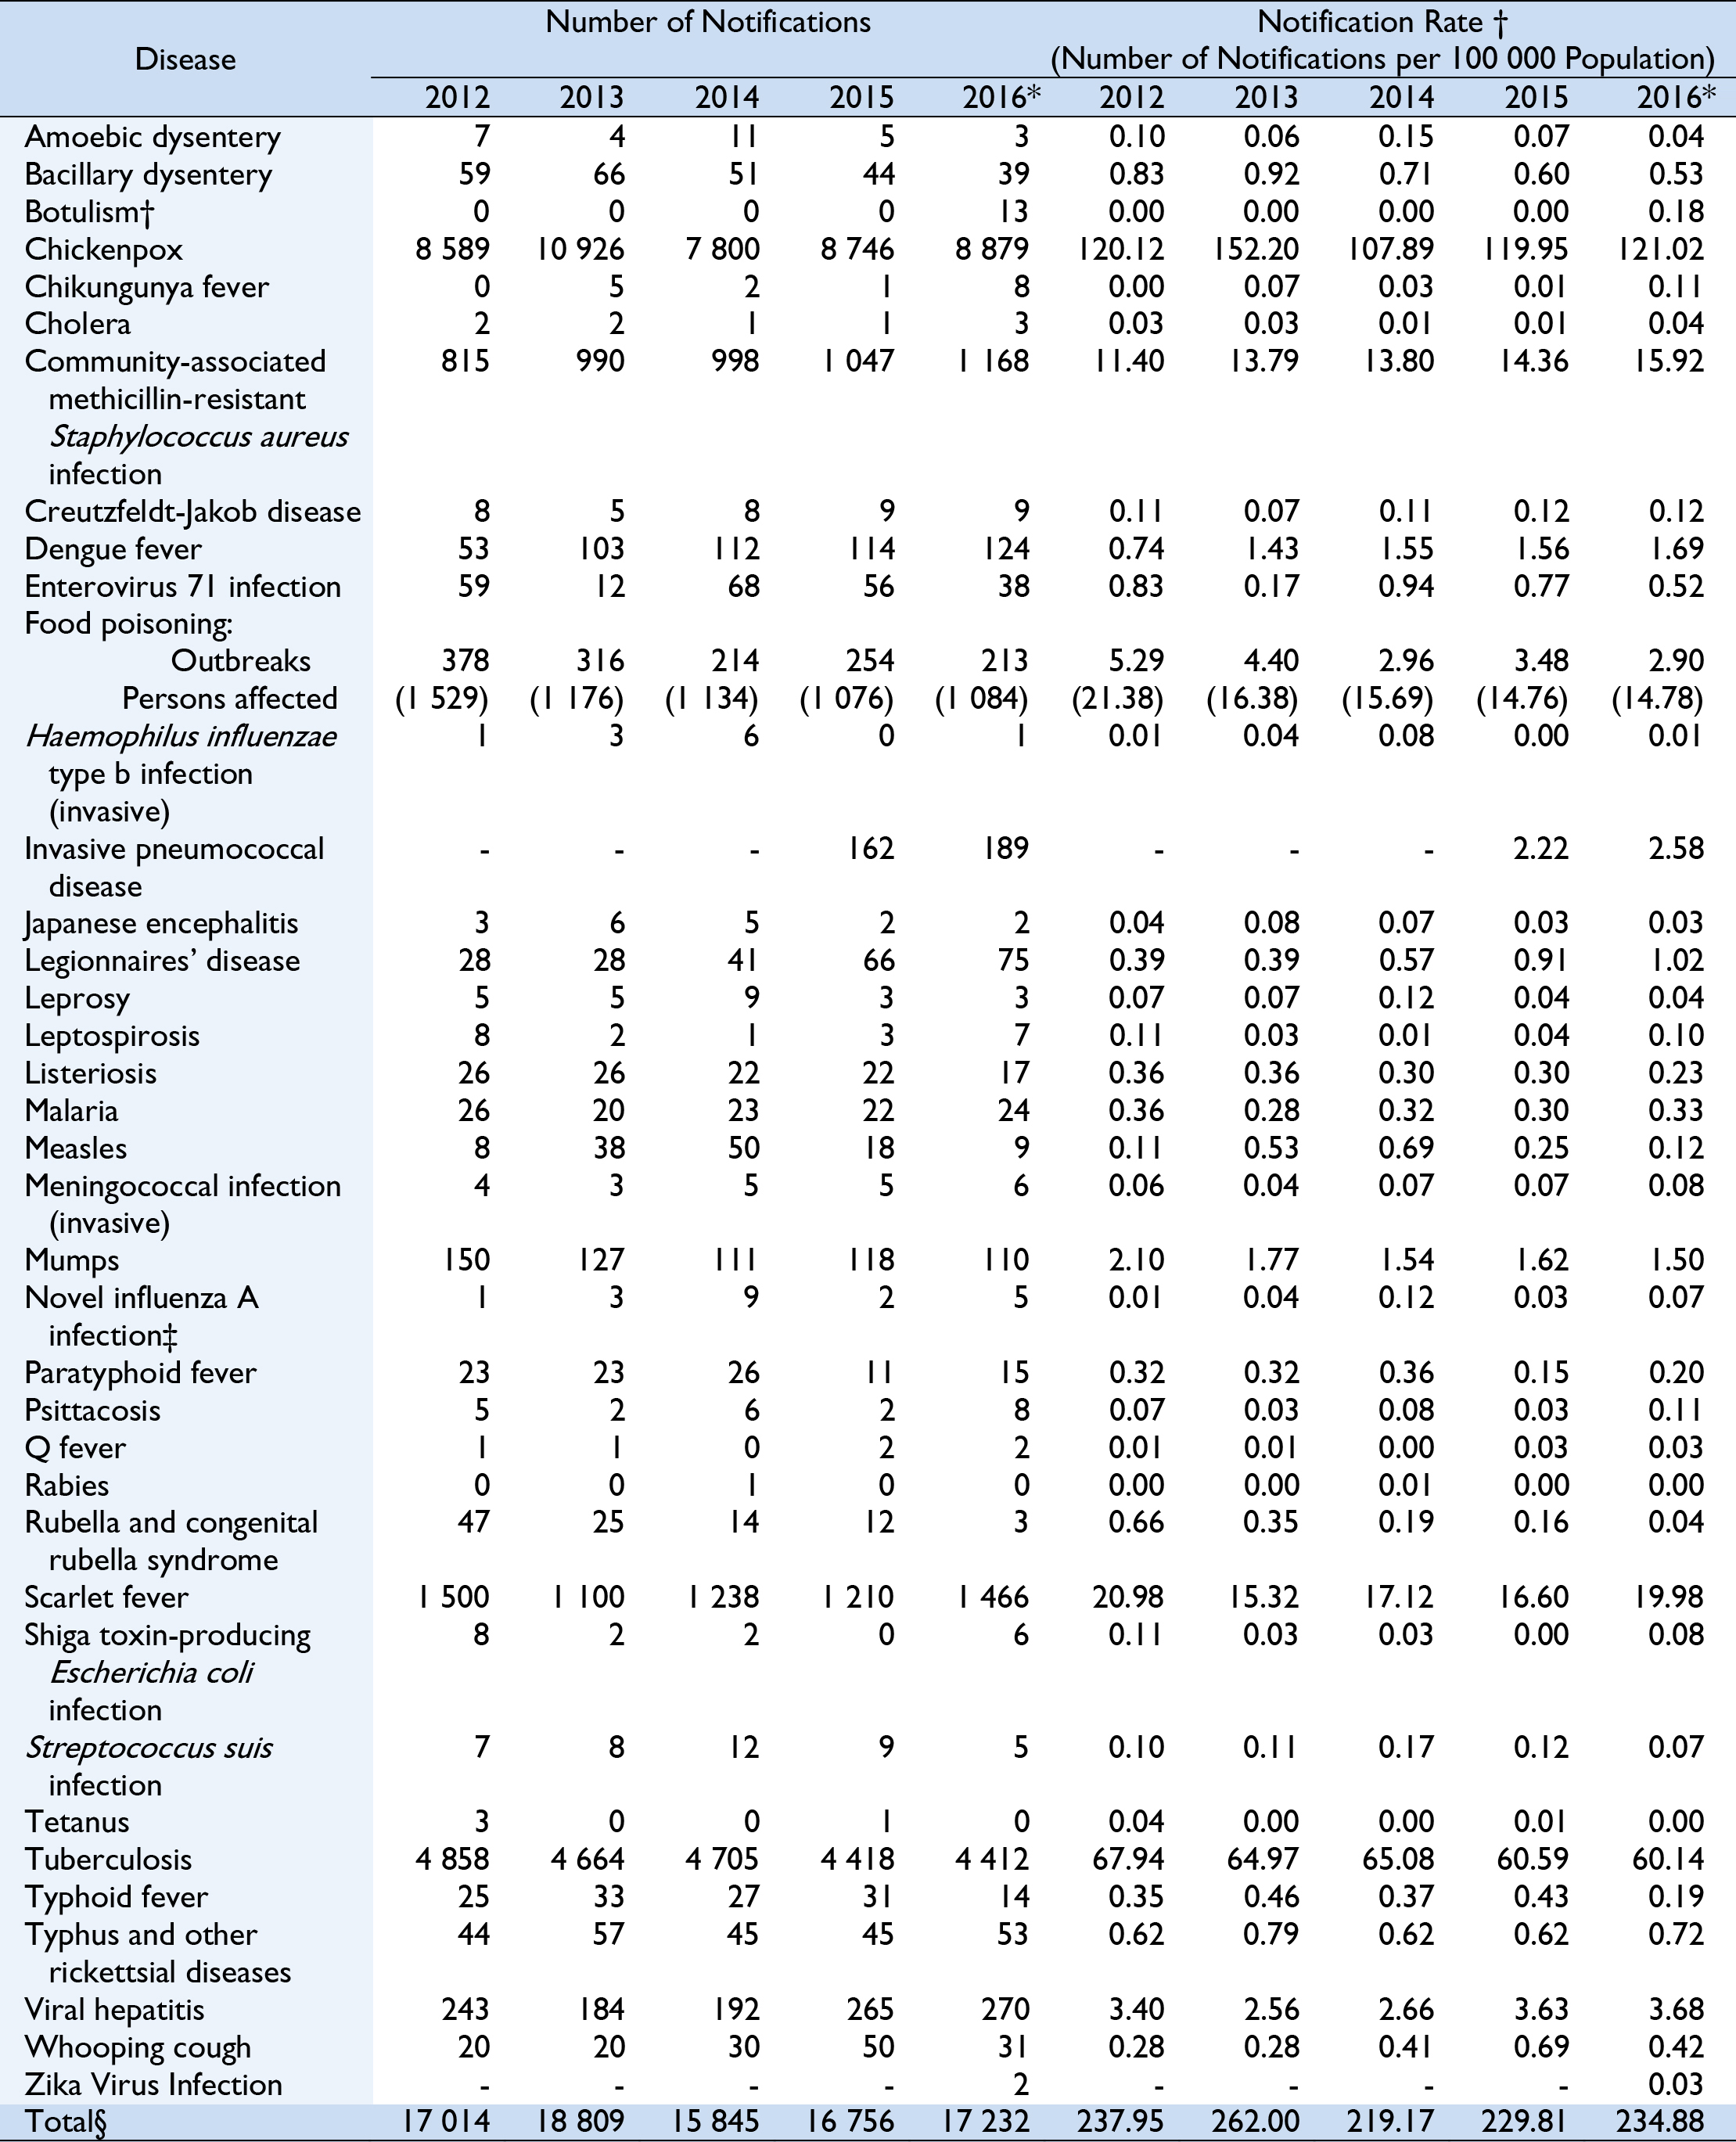
Note:
Number of notified cases refers to notifications of infectious disease cases known to the Department of Health as of 10 November 2017.
No case of Acute poliomyelitis, Anthrax, Diphtheria, Hantavirus infection, Middle East Respiratory Syndrome, Plague, Relapsing fever, Severe Acute Respiratory Syndrome, Smallpox, Viral haemorrhagic fever, West Nile Virus Infection or Yellow fever was reported during the specified years.
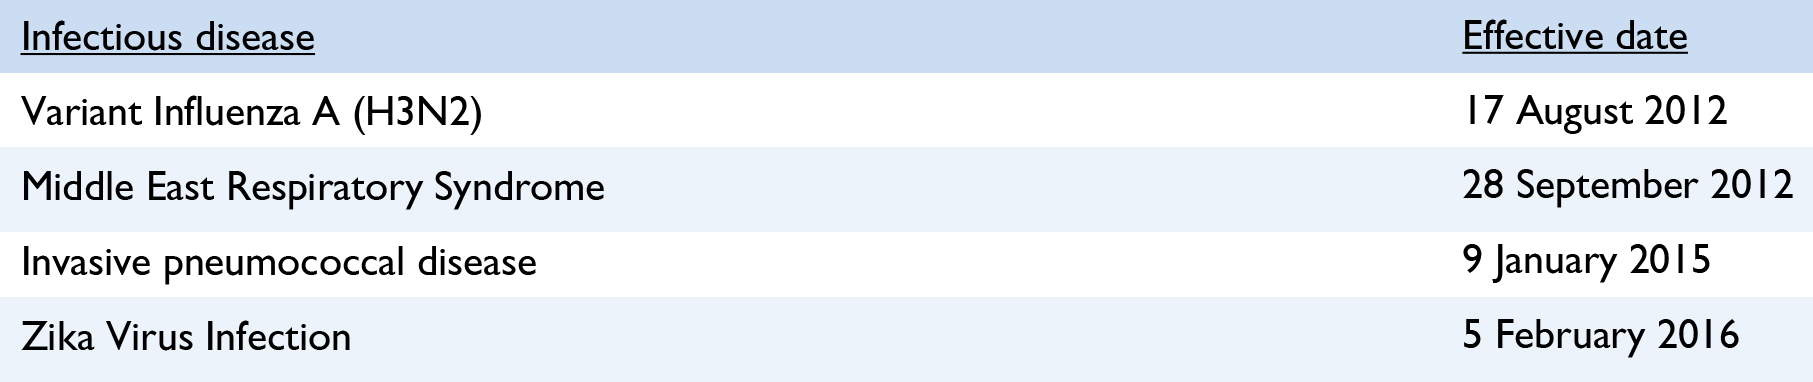
Infectious diseases which have been made notifiable during the period include:
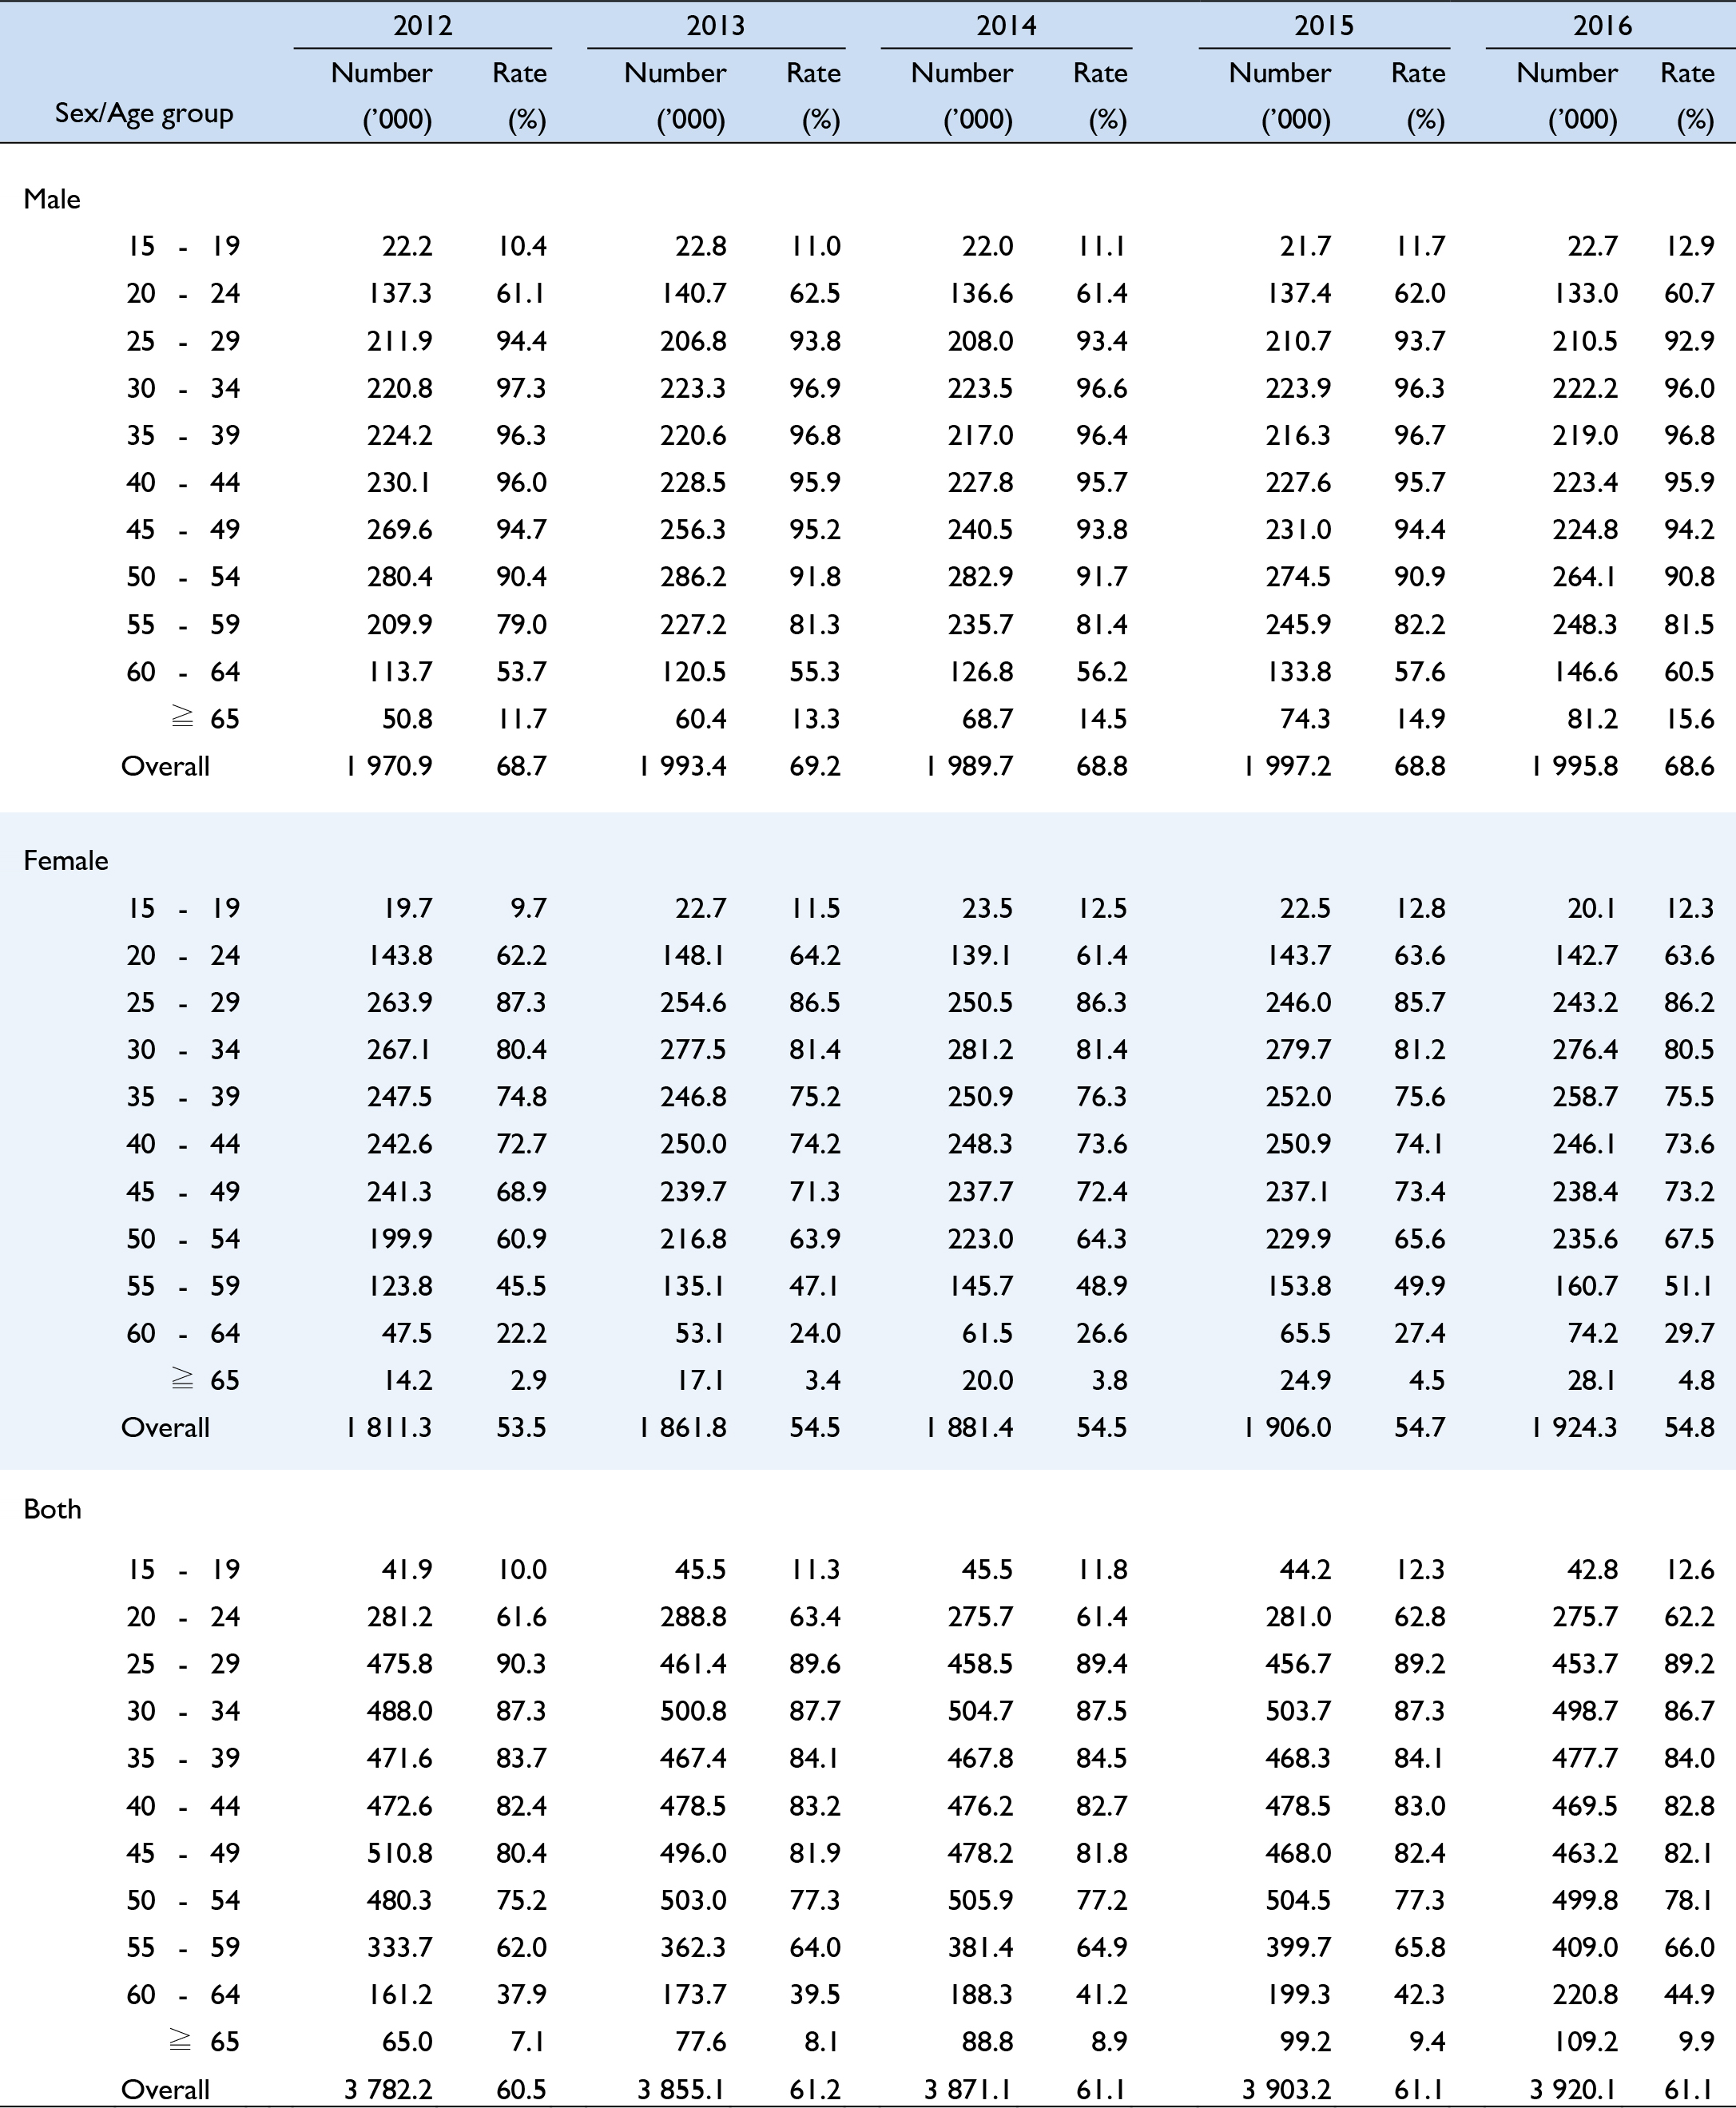
 The 2016 Population By-census conducted by the Census and Statistics Department from June to August 2016 provides a benchmark for revising the population figures compiled since the 2011 Population Census. Population-related figures from 2012 to 2015 have been revised accordingly.
* Provisional figures.
† A revised case definition of Botulism has been adopted since May 2016.
‡ Novel influenza A infection has been listed as a notifiable infectious disease since 21 February 2014, which has replaced Influenza A (H2), Variant influenza A (H3N2), Influenza A (H5), Influenza A (H7) and Influenza A (H9).
§ Number of persons affected in food poisoning cases is excluded.
- Not applicable.
Notes:
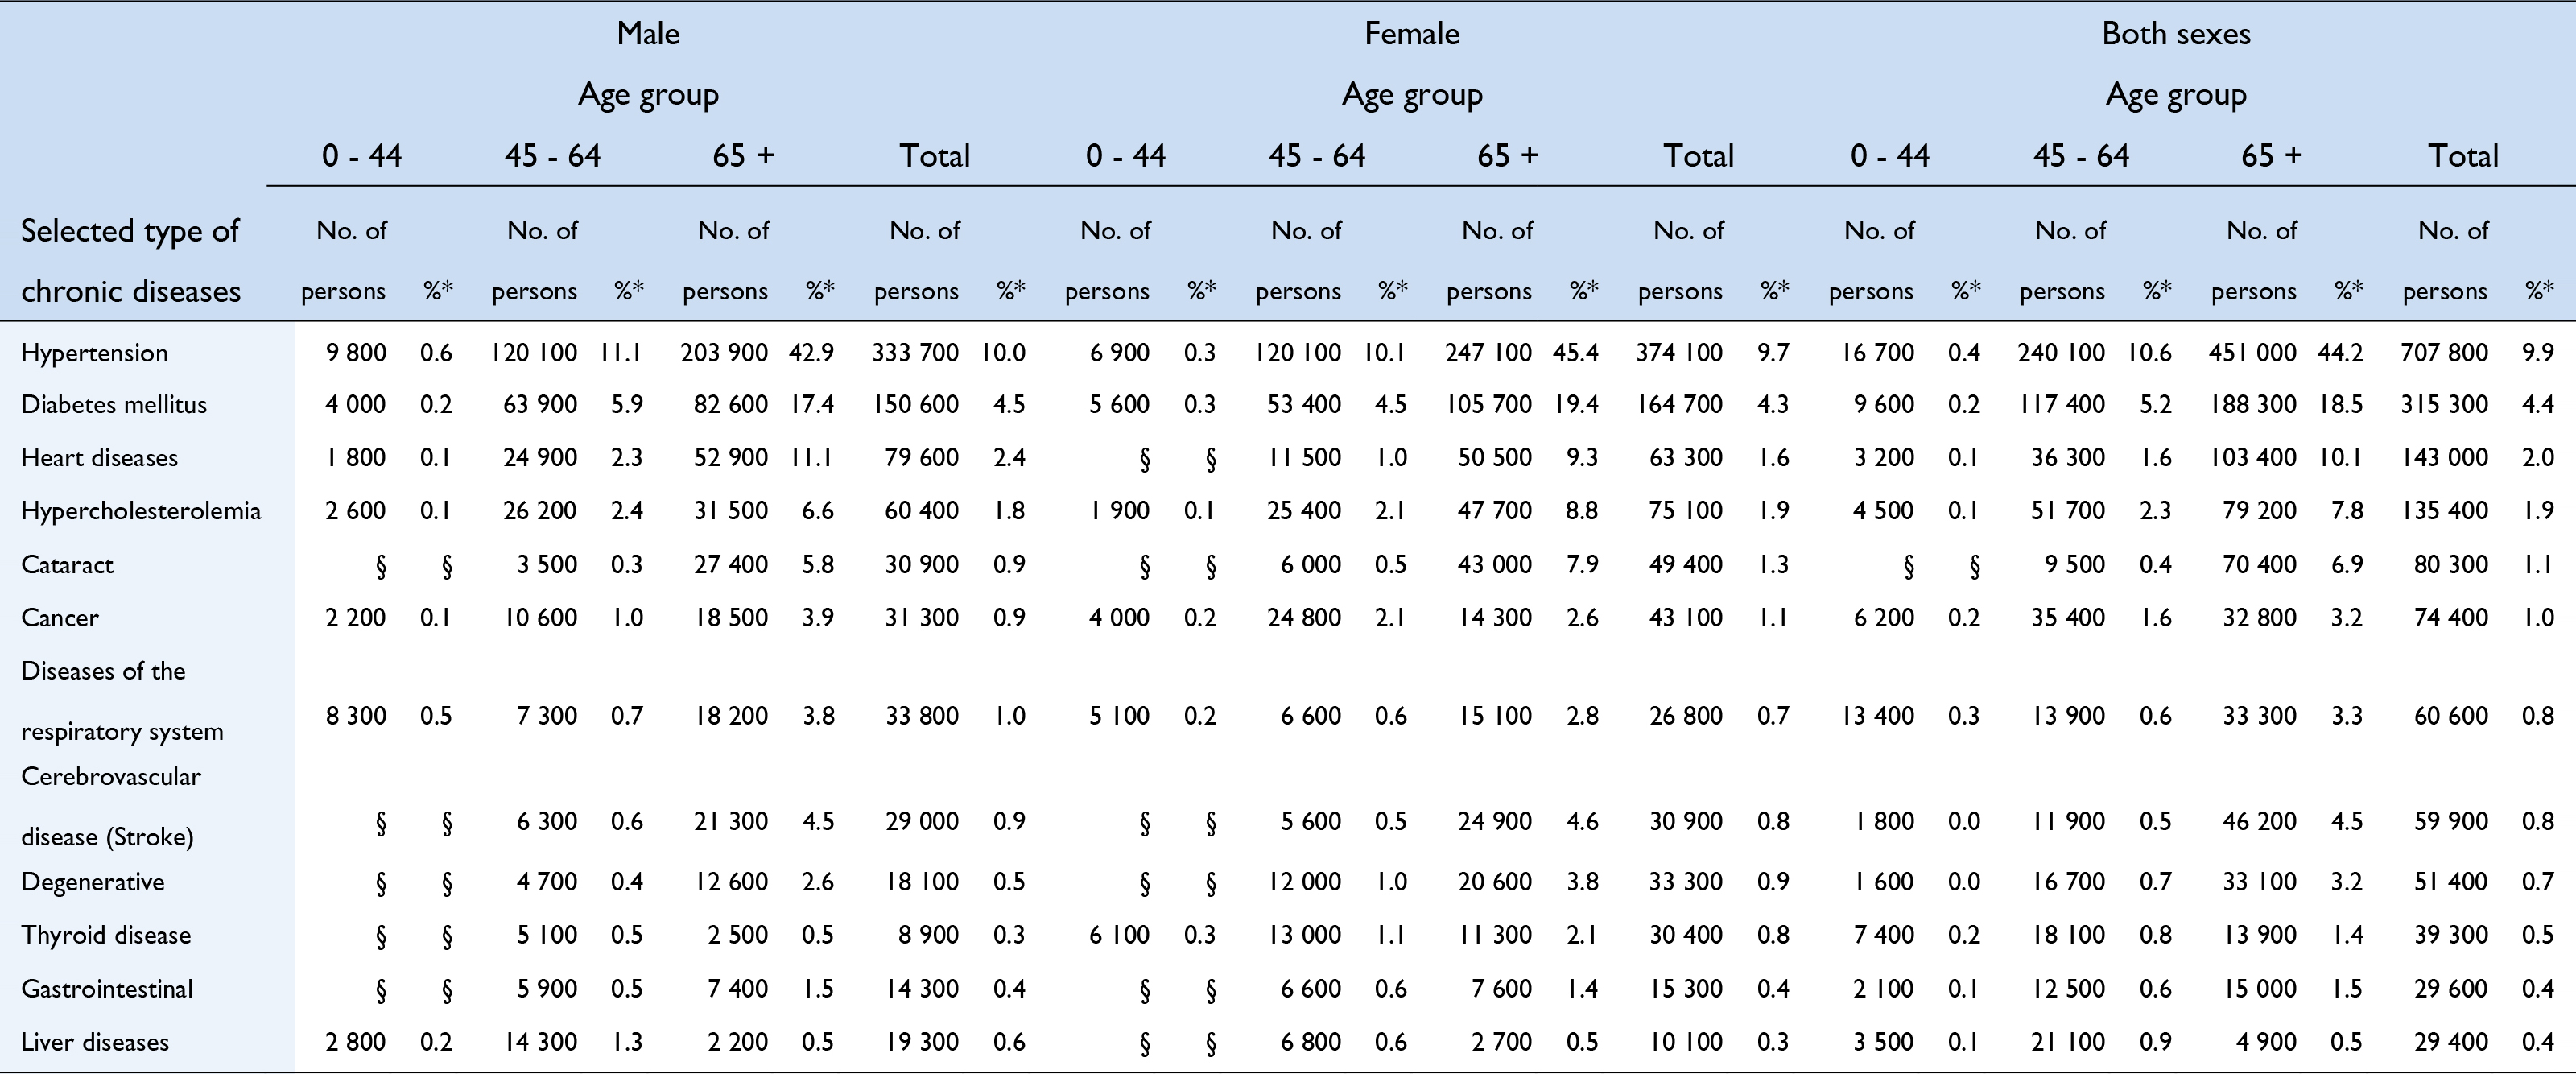
* As a percentage of all persons in the respective sex and age sub-groups.
§ Statistics are not released due to large sampling errors.
0.0 Means less than 0.05%
Source:
Survey on Persons with Disabilities and Chronic Diseases, 2013. (The survey is conducted on an ad hoc basis and was conducted once only during the last five years.)
Notes:
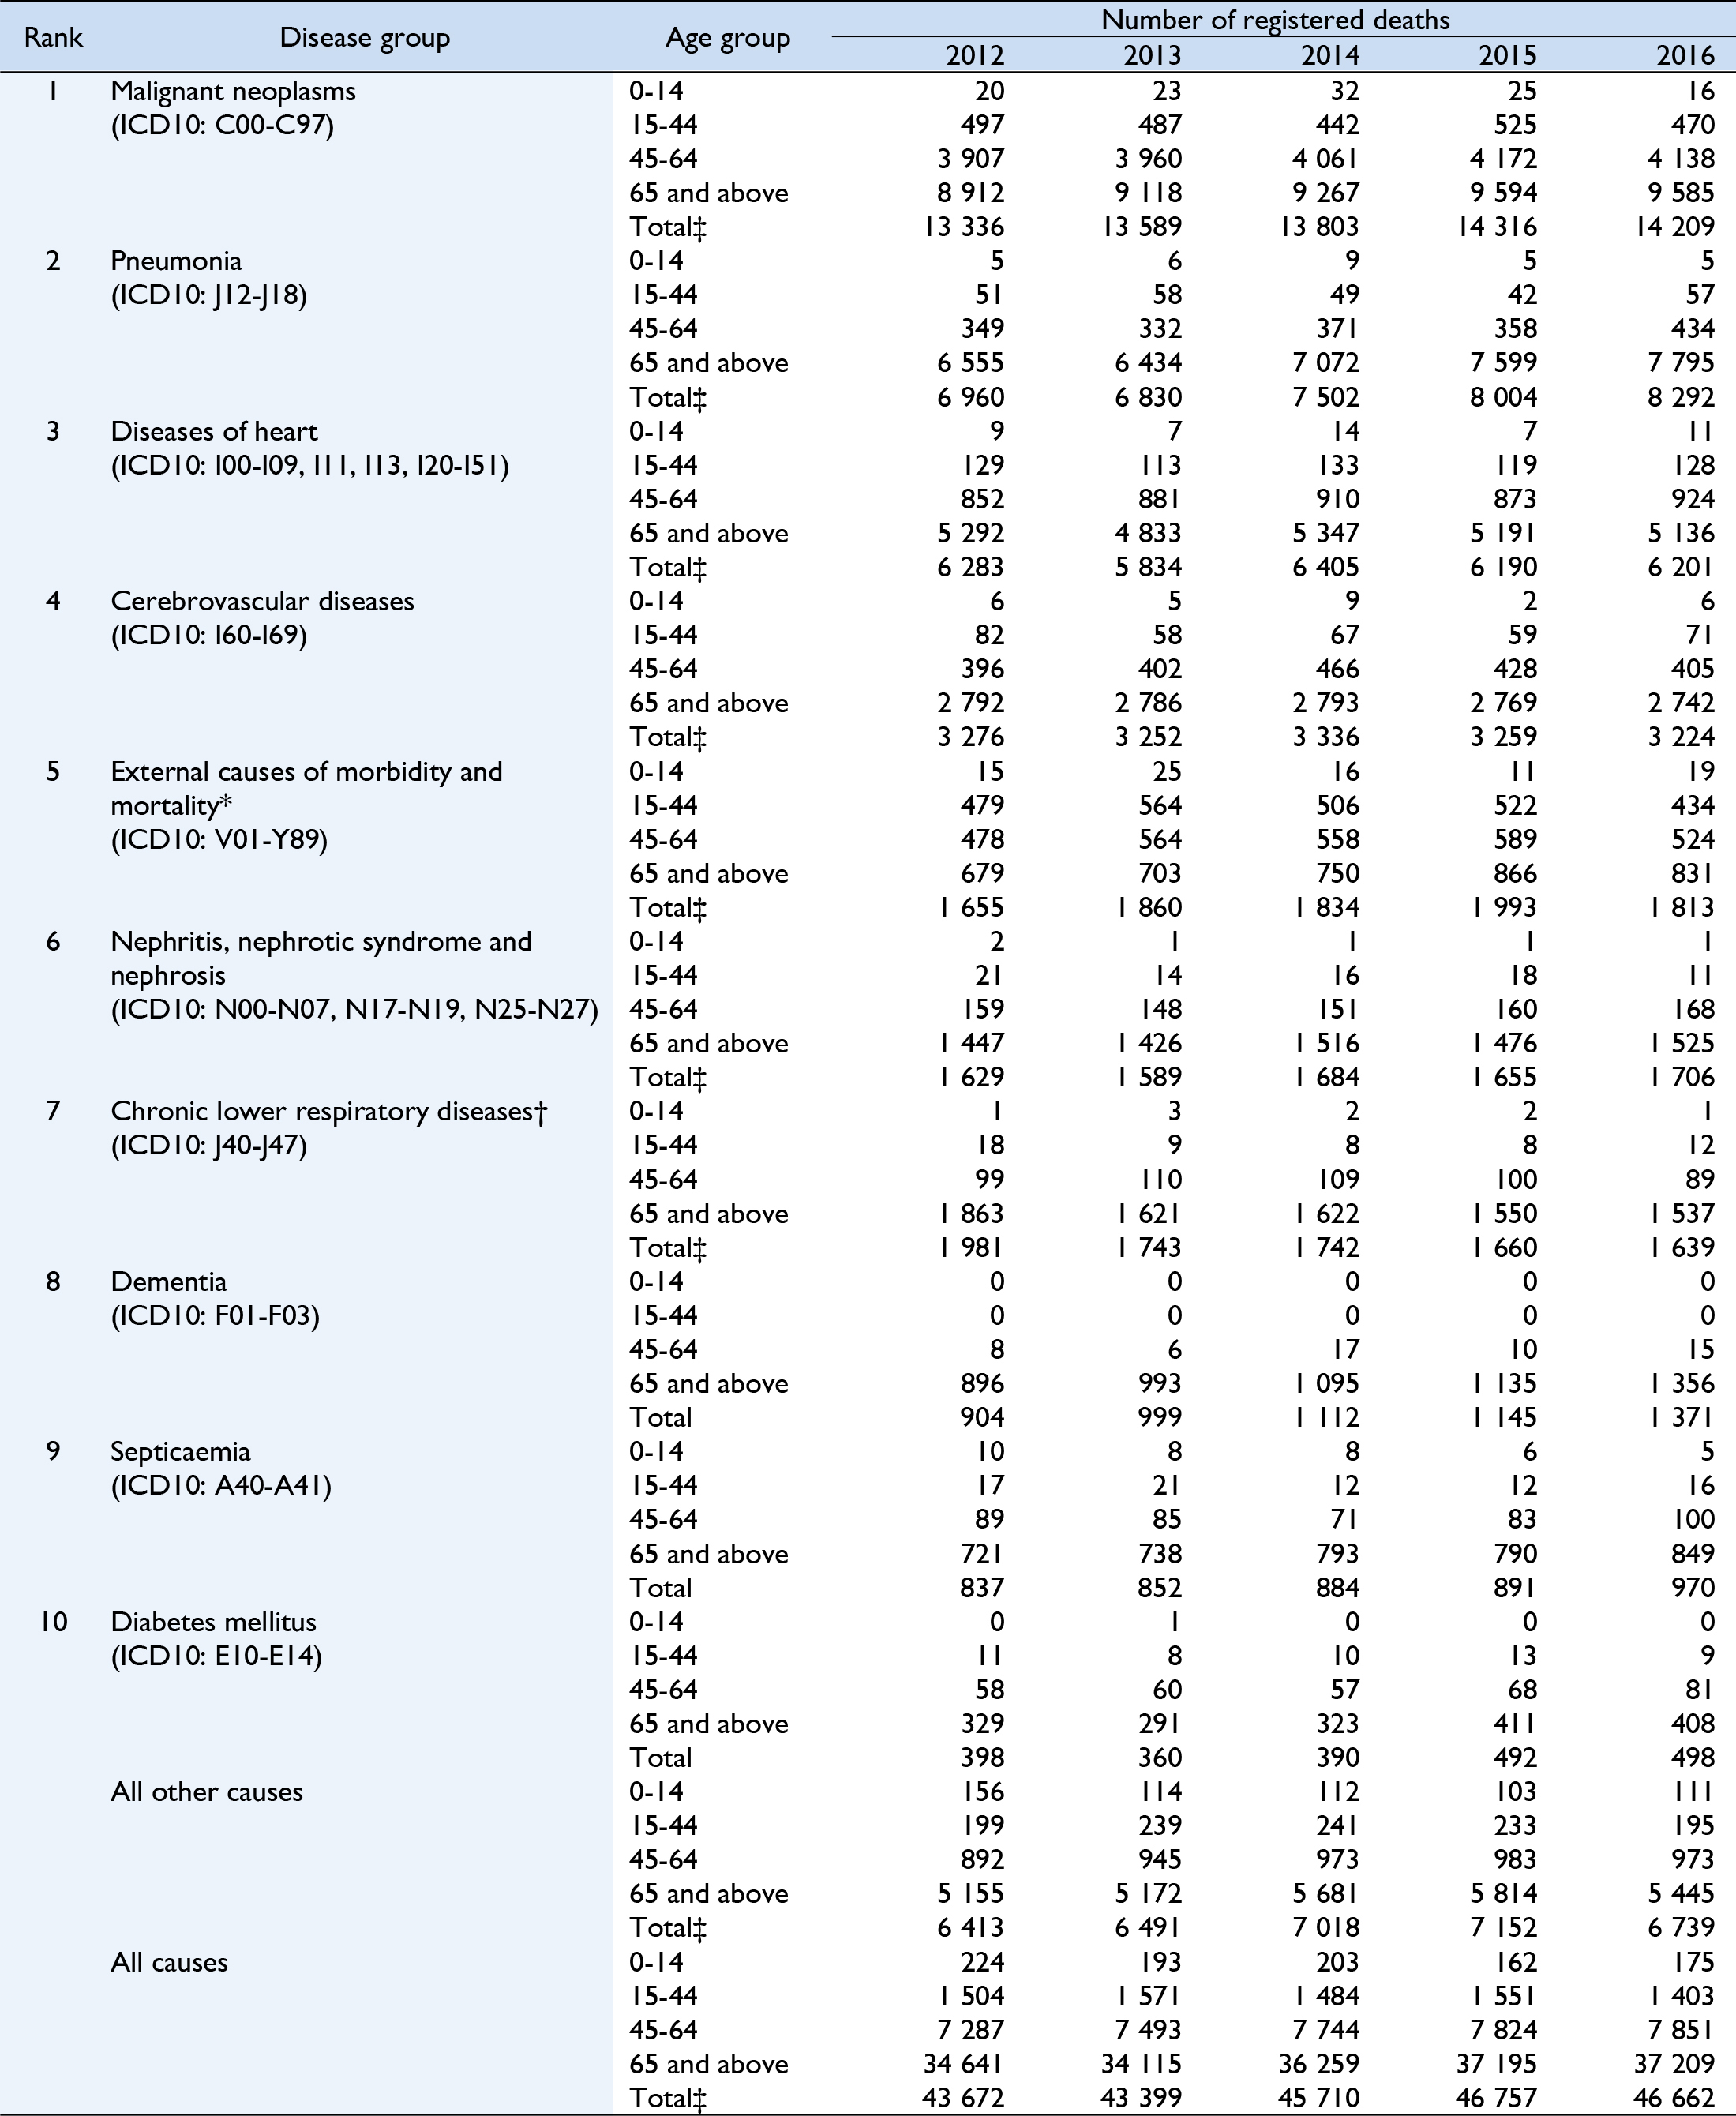
Classification of diseases and causes of death is based on the International Statistical Classification of Diseases and Related Health Problems (ICD) 10th Revision from 2001 onwards.
* According to the ICD 10th Revision, when the morbid condition is classifiable under Chapter XIX as “injury, poisoning and certain other consequences of external causes”, the codes under Chapter XX for “external causes of morbidity and mortality” should be used as the primary cause of death.
† Chronic lower respiratory diseases have been included as a disease group for the purpose of ranking the causes of death since 2001.
‡ Including unknown age.
Notes:
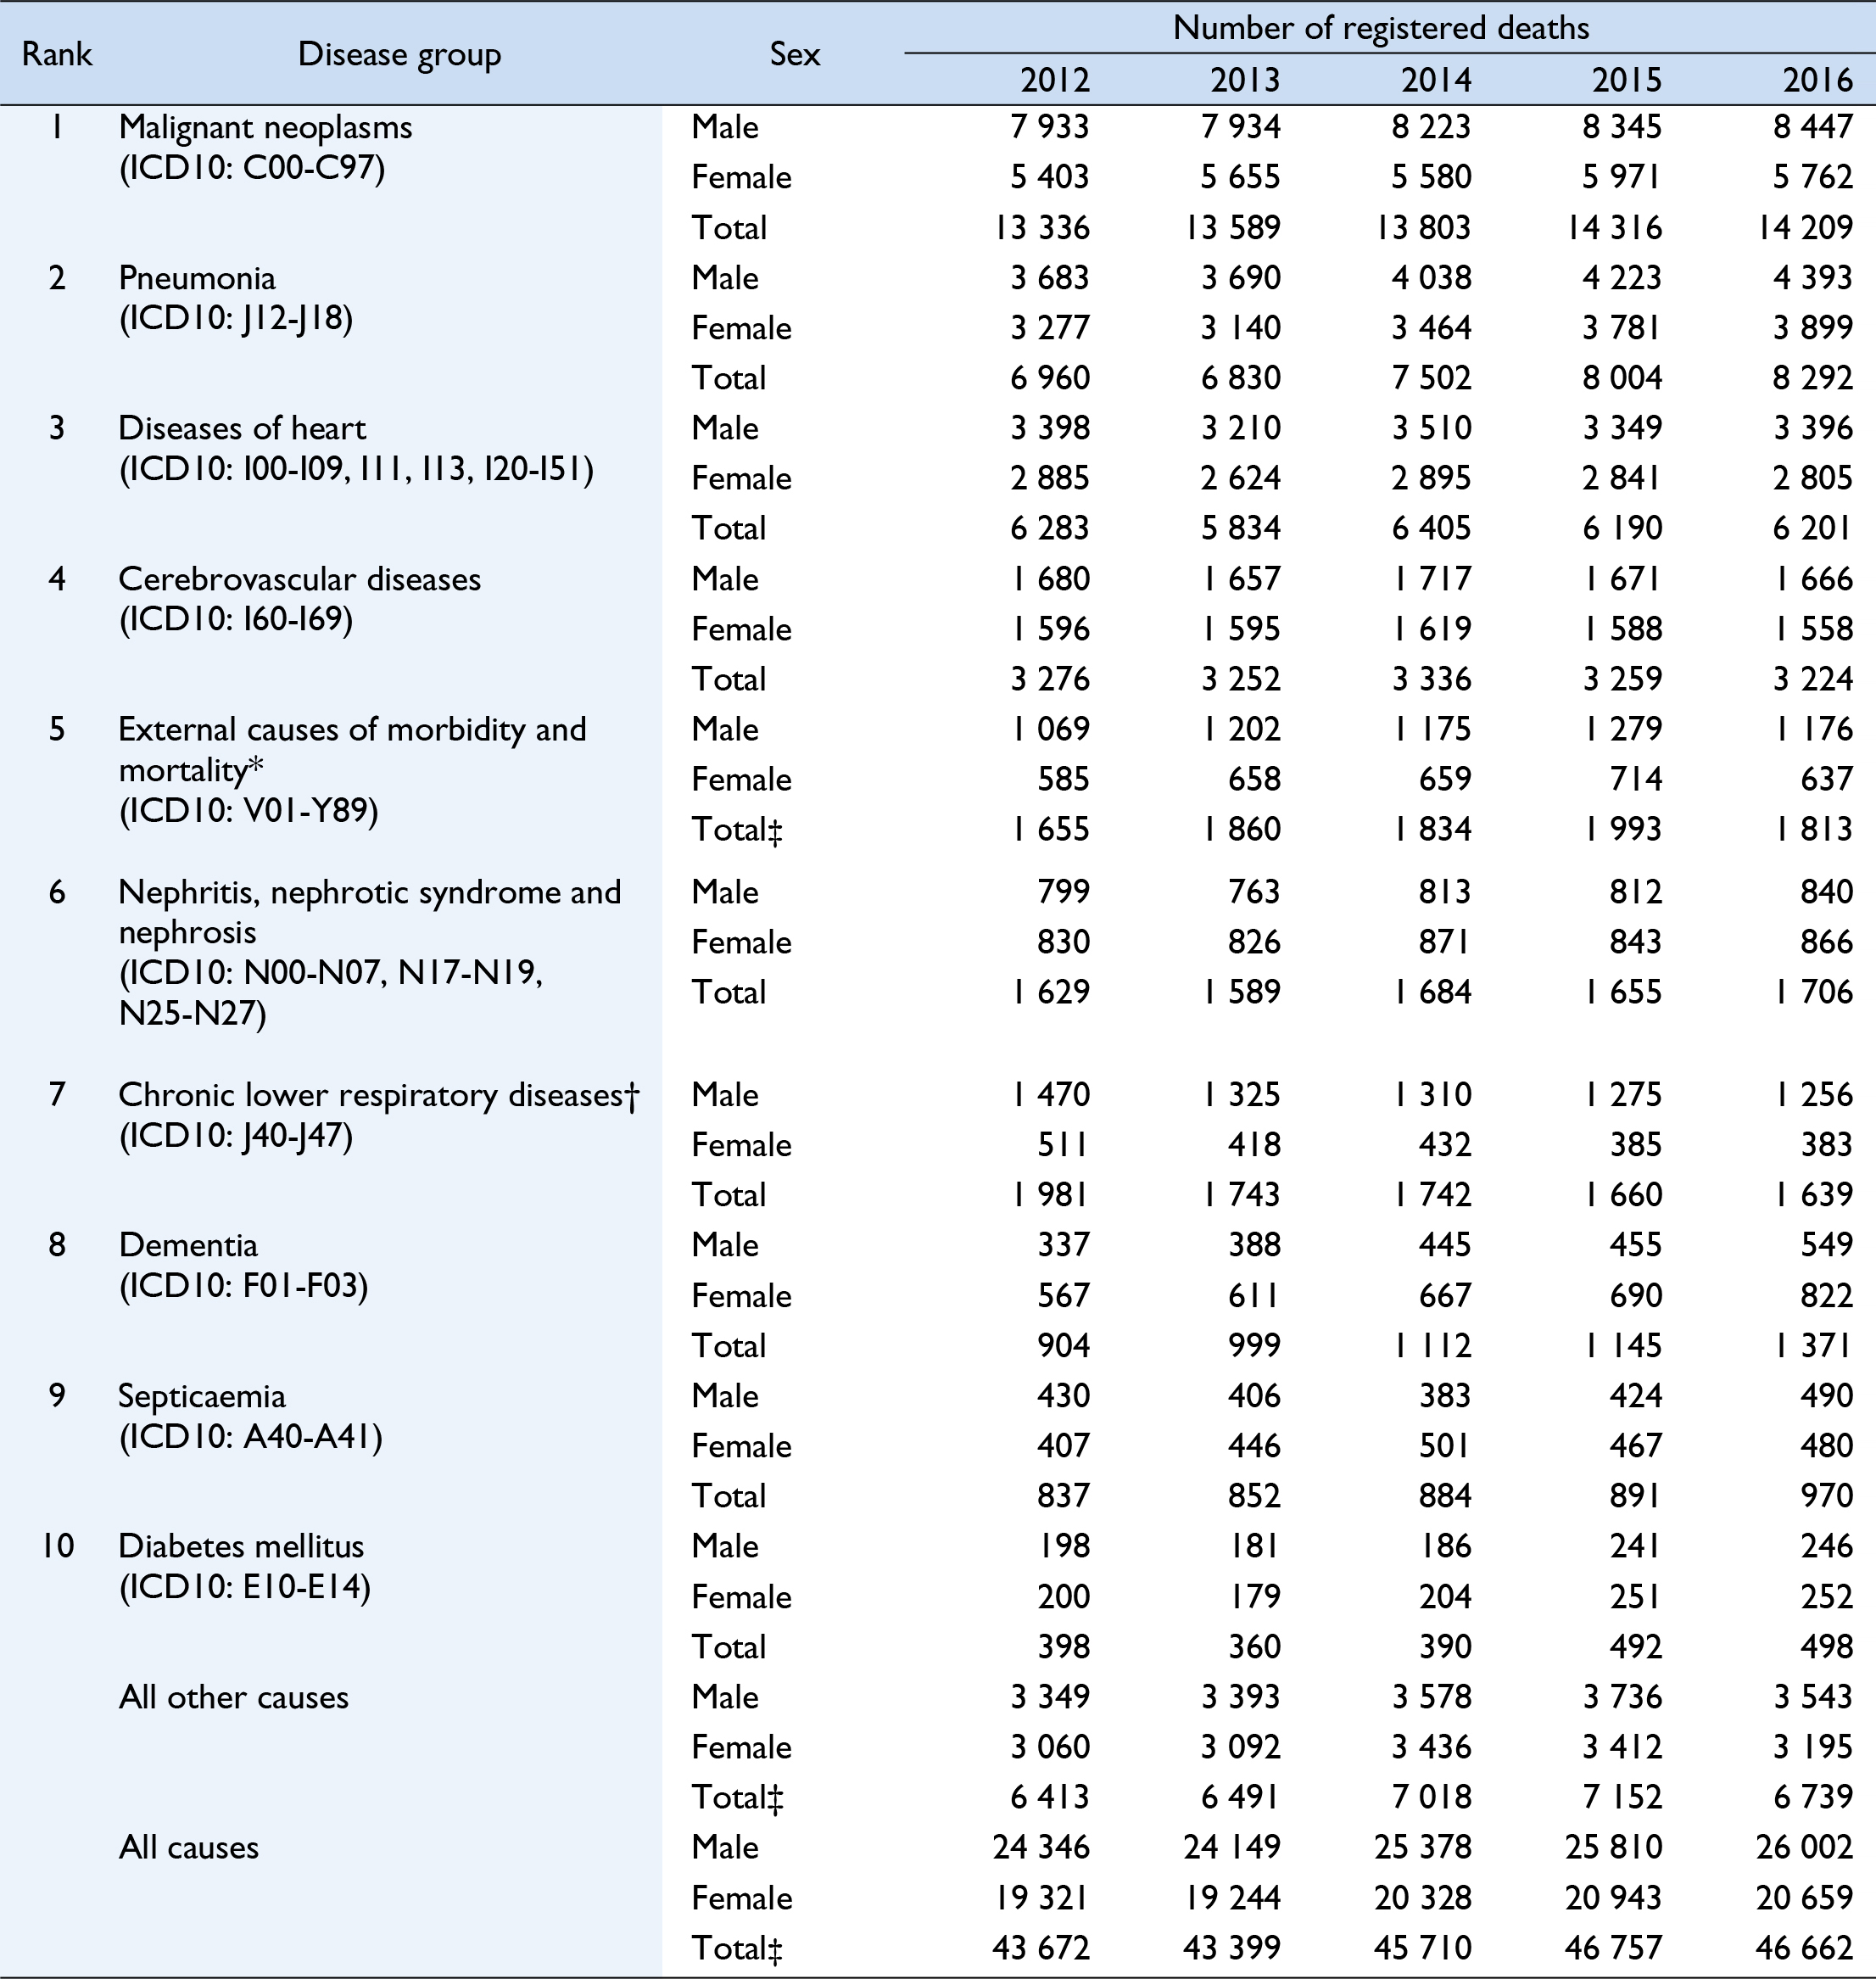
Classification of diseases and causes of death is based on the International Statistical Classification of Diseases and Related Health Problems (ICD) 10th Revision from 2001 onwards.
* According to the ICD 10th Revision, when the morbid condition is classifiable under Chapter XIX as “injury, poisoning and certain other consequences of external causes”, the codes under Chapter XX for “external causes of morbidity and mortality” should be used as the primary cause of death.
† Chronic lower respiratory diseases have been included as a disease group for the purpose of ranking the causes of death since 2001.
‡ Including unknown sex.
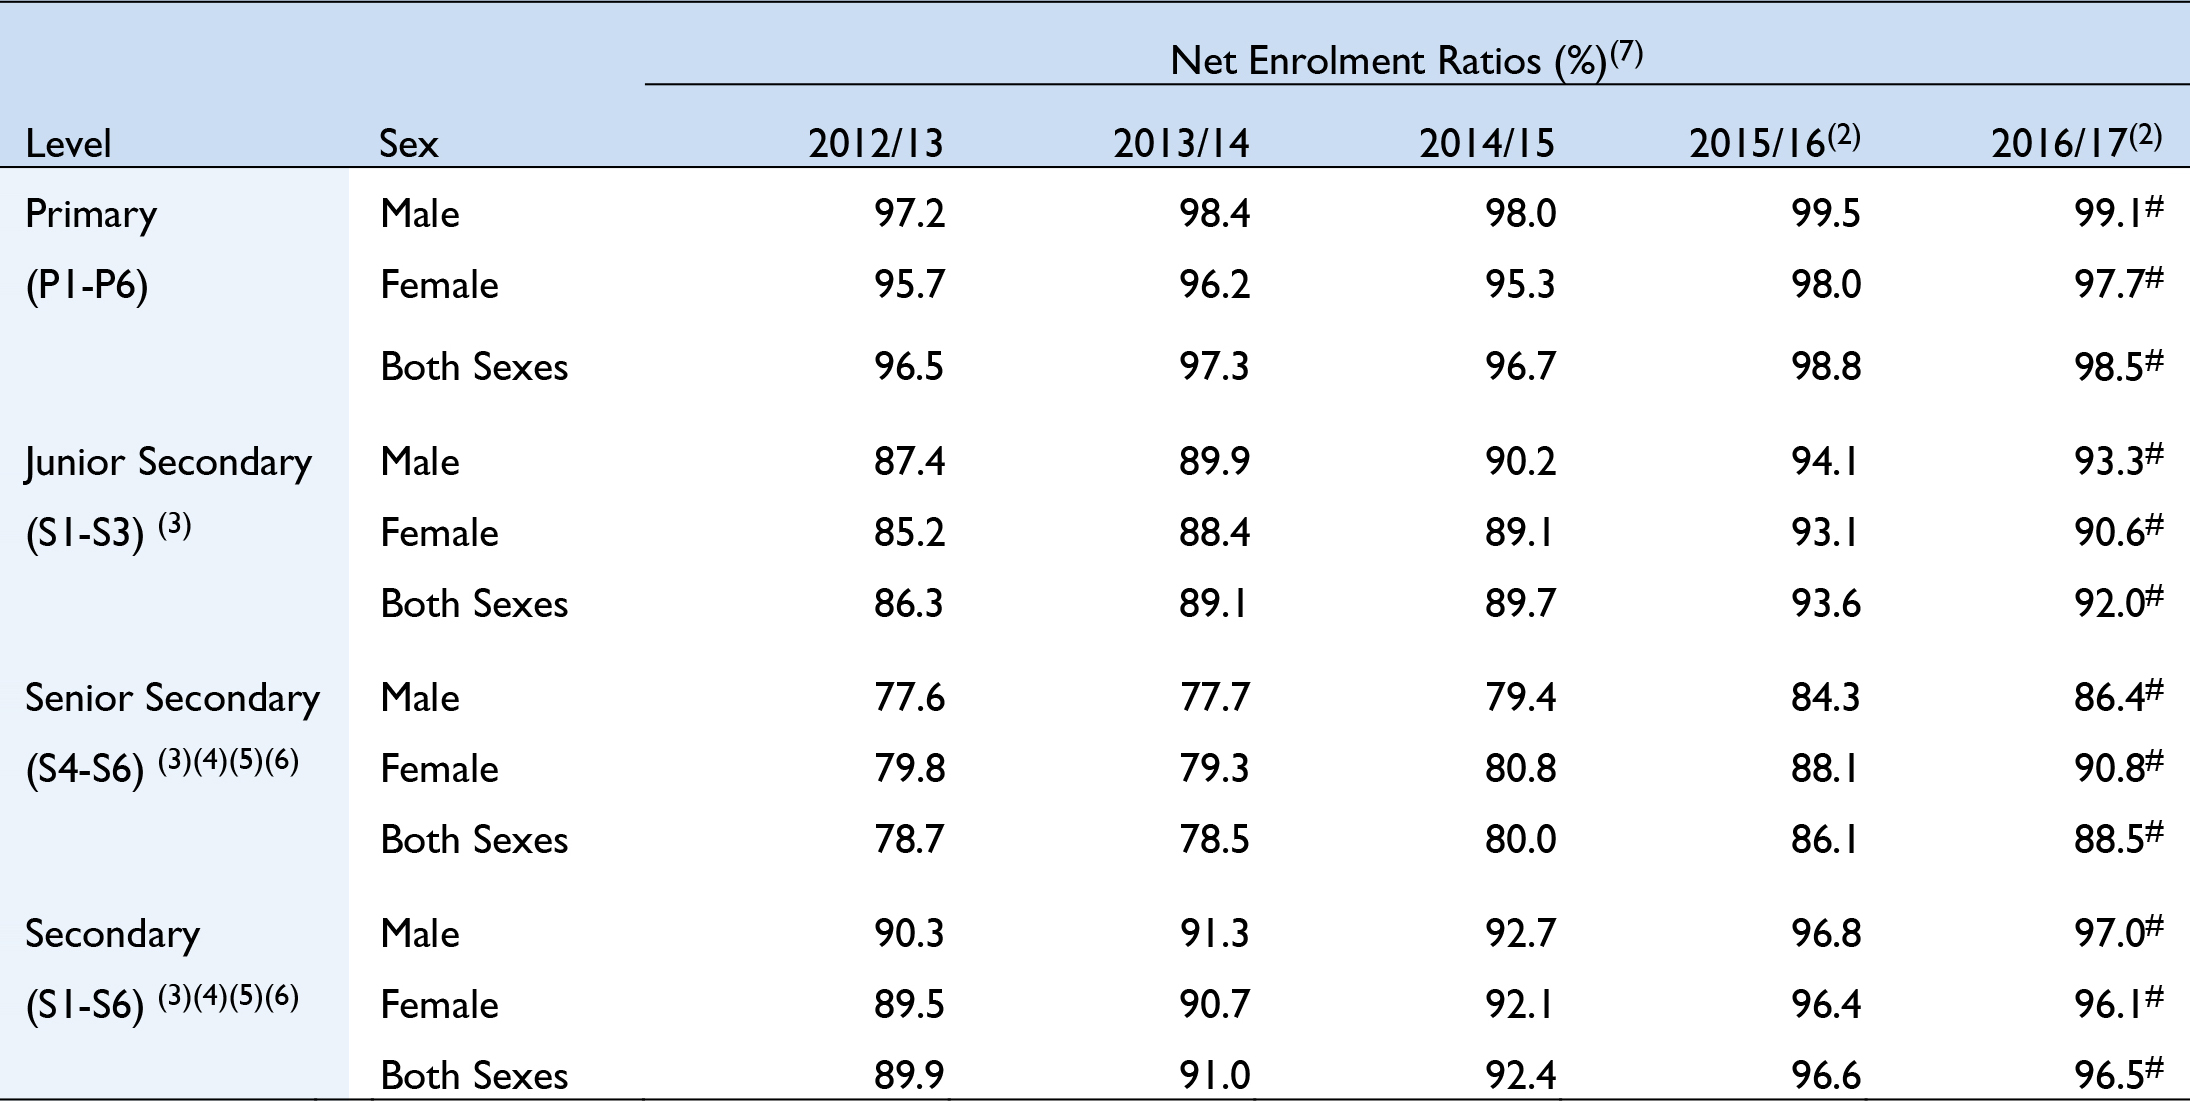
Notes:
Figures include students attending in both day and evening schools, special schools and special classes.
(1) “Net enrolment ratio (NER)” is defined as the total number of students in the theoretical age group for a given level of education enrolled in that level, expressed as a percentage of the total population in that age group. In Hong Kong, the theoretical age groups for primary level, junior secondary level (i.e. Secondary 1-3) and senior secondary level (i.e. Secondary 4-6) are aged 6-11, aged 12-14 and aged 15-17 respectively. Since some children in a theoretical age group could be enrolled across other education levels, the NER is below 100% despite that nine years of free and universal primary and junior secondary education is provided in Hong Kong.
(2)Hong Kong has been providing nine years of free and universal basic education (six years of primary education and three years of junior secondary education) through public sector primary and secondary schools (including government schools, aided schools and caput schools) since 1978. The minimum age for entering public sector primary education in Hong Kong is five years and eight months as at 1 September of the year, which corresponds to six years old as at 31 December of the year. Starting from the 2015/16 school year, the reference time point for counting of age is shifted to 31 December of the year for compilation of Net Enrolment Ratio to better reflect Hong Kong students’ schooling situation.
(3) Figures include correctional/residential home under the Social Welfare Department and correctional institutions under the Correctional Services Department.
(4)Figures include students enrolled in craft level courses and Diploma Yi Jin Programme.
(5) Figures include secondary day courses operated by private schools offering tutorial, vocational and adult education courses.
(6) The New Senior Secondary academic structure has been implemented fully from 2011/12 school year onwards. The Net Enrolment Ratio at secondary level from this year is compiled based on school-age population 12-17.
(7) The 2016 Population By-census conducted from June to August 2016 provides a benchmark for revising the population figures compiled since the 2011 Population Census. Population figures from end-2011 to mid-2016 have been revised accordingly. Net Enrolment Ratio has been compiled using the revised population figures.
# Provisional figures
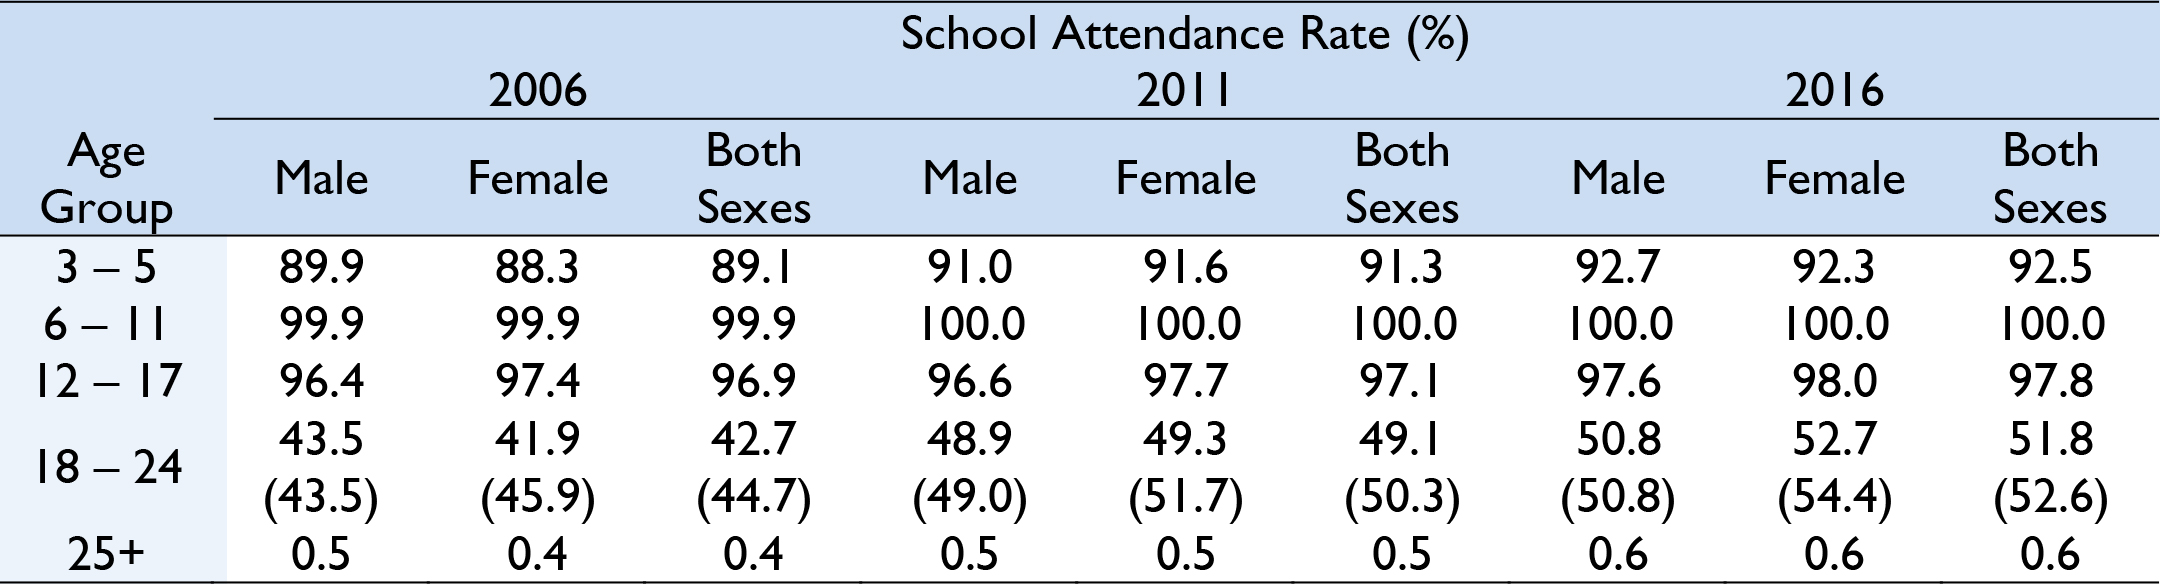
Notes:
Figures in brackets are school attendance rates compiled with foreign domestic helpers excluded from the population in the respective age-sex groups.

Notes:
Figures refer to the position as at mid-September of the respective school years.Figures include Government, aided and caput schools, but exclude special schools.
Notes:
The 2016 Population By-census conducted from June to August 2016 provides a benchmark for revising the population figures compiled since the 2011 Population Census. In the above table, population-related figures from 2012 to 2015 have been revised accordingly.
§ Statistics are not released due to large sampling errors.
Notes:
The 2016 Population By-census conducted from June to August 2016 provides a benchmark for revising the population figures compiled since the 2011 Population Census. In the above table, population-related figures from 2012 to 2015 have been revised accordingly.
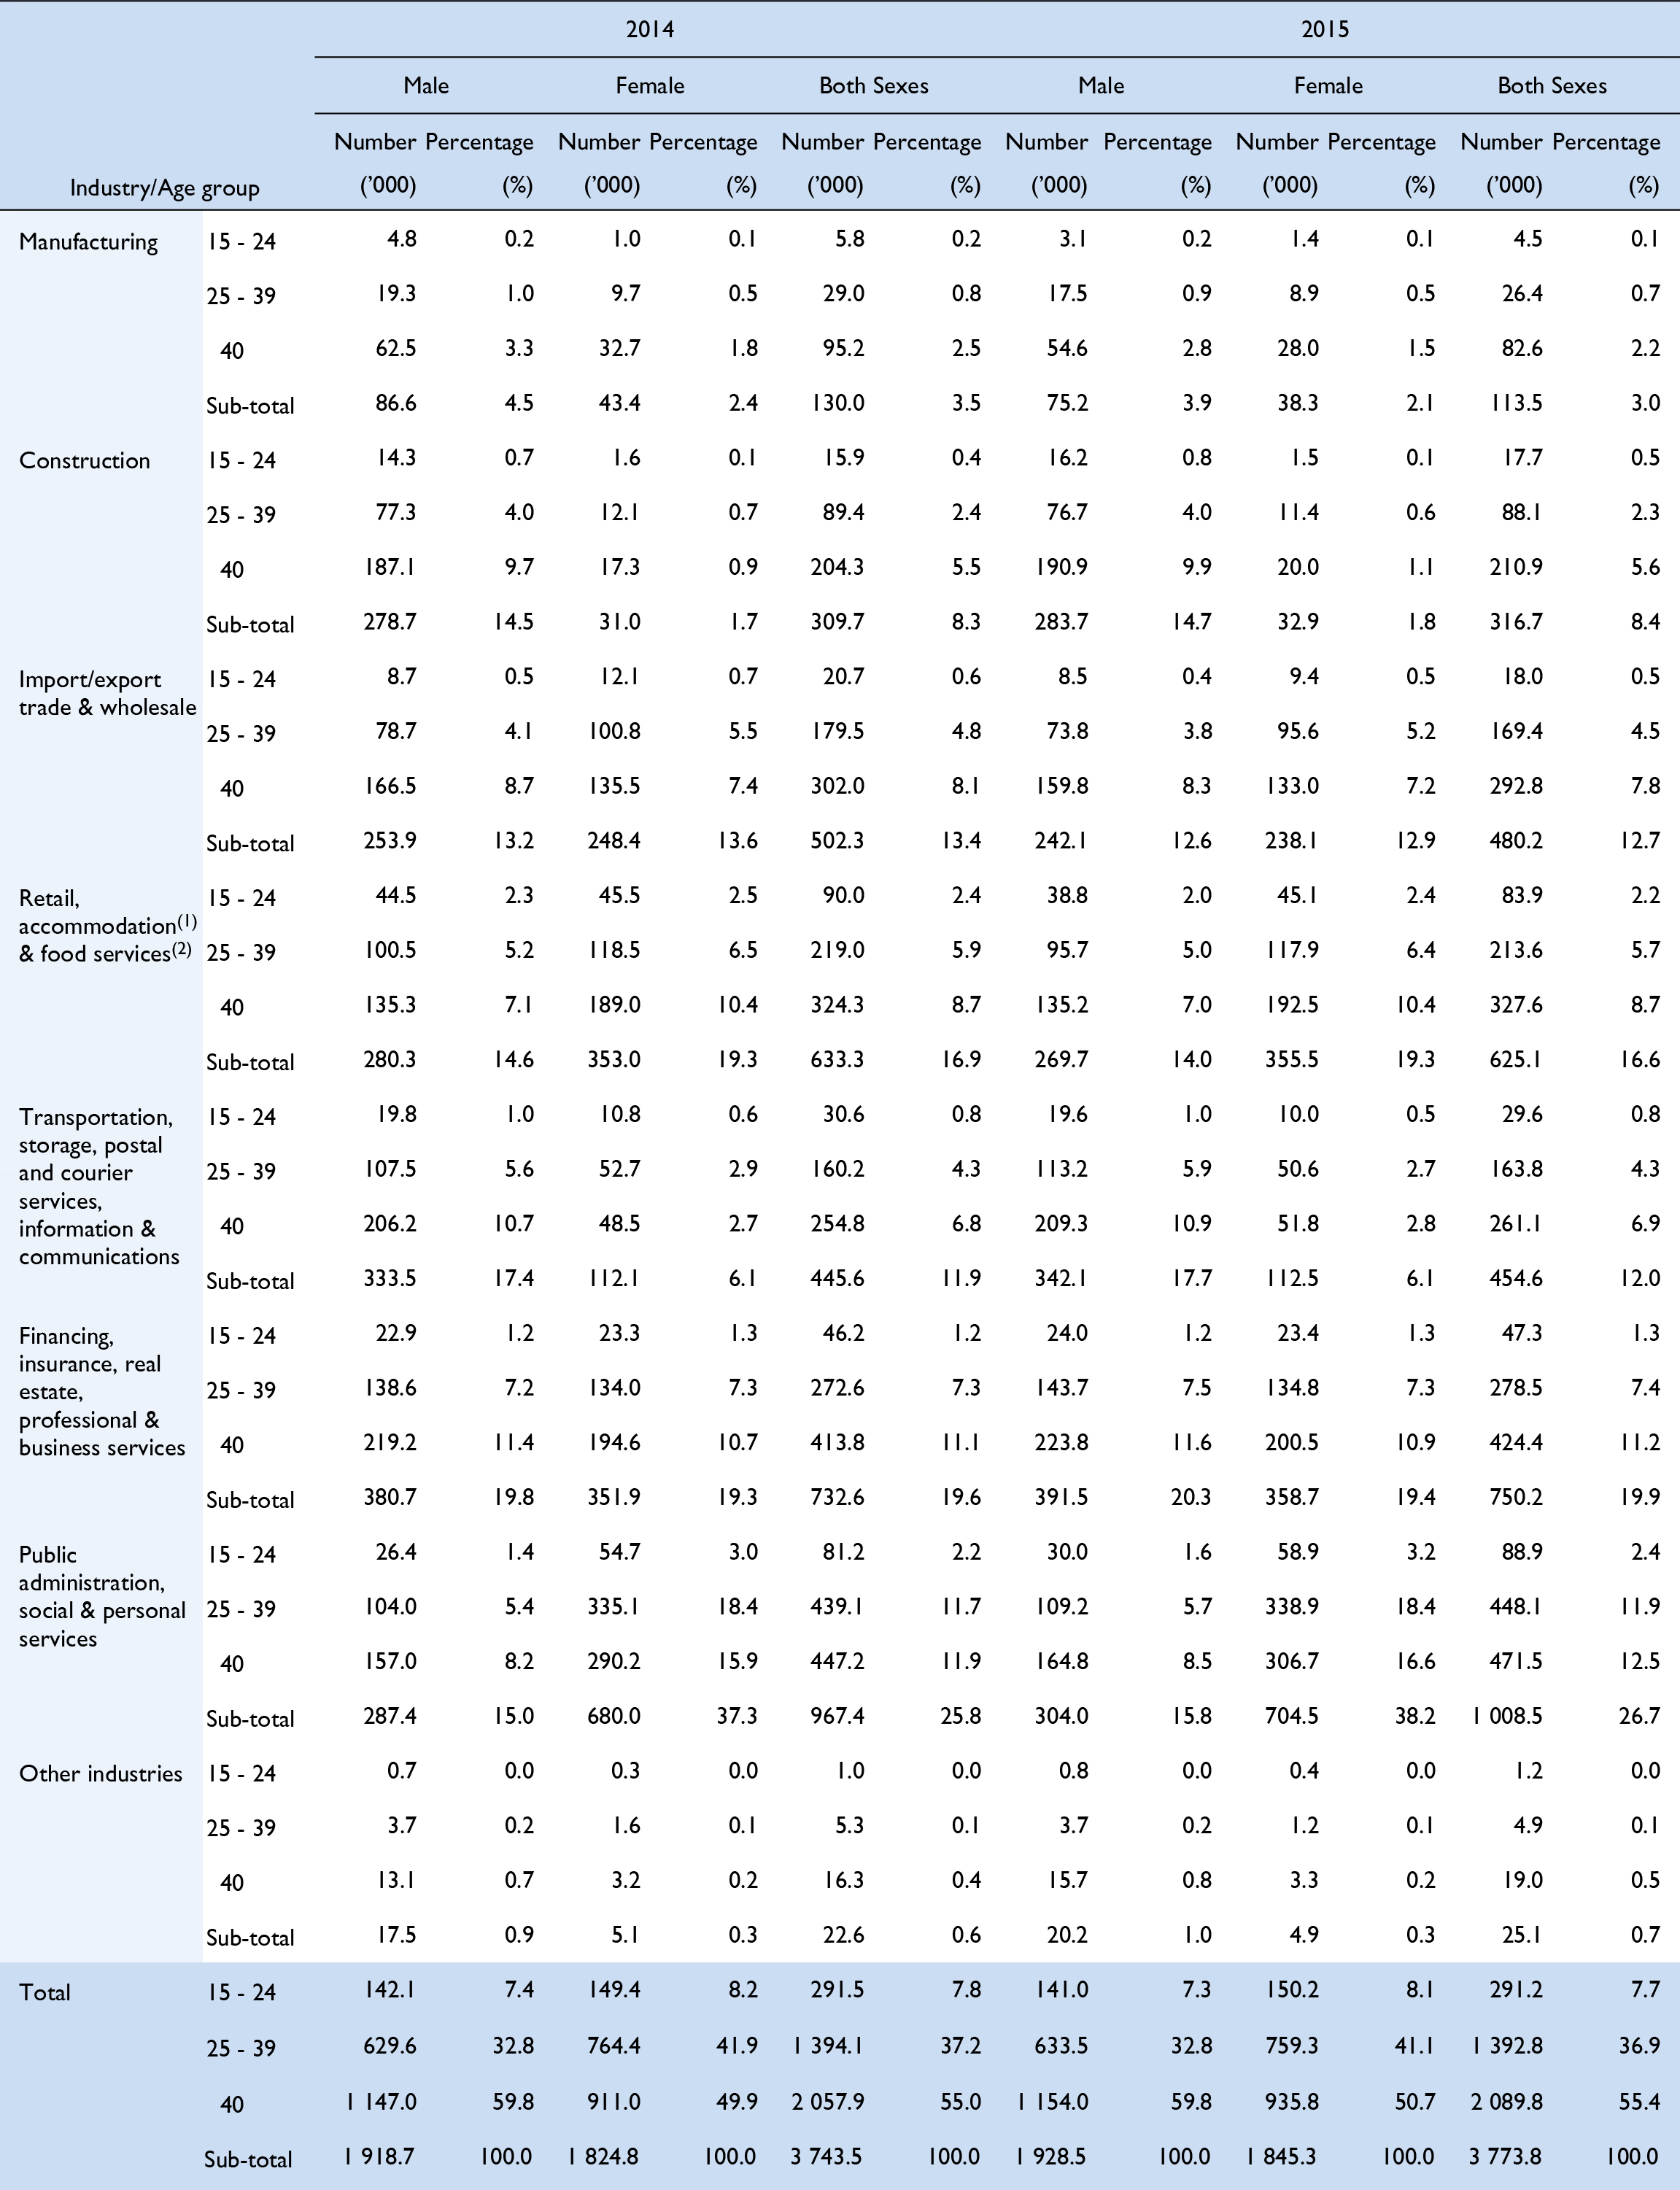
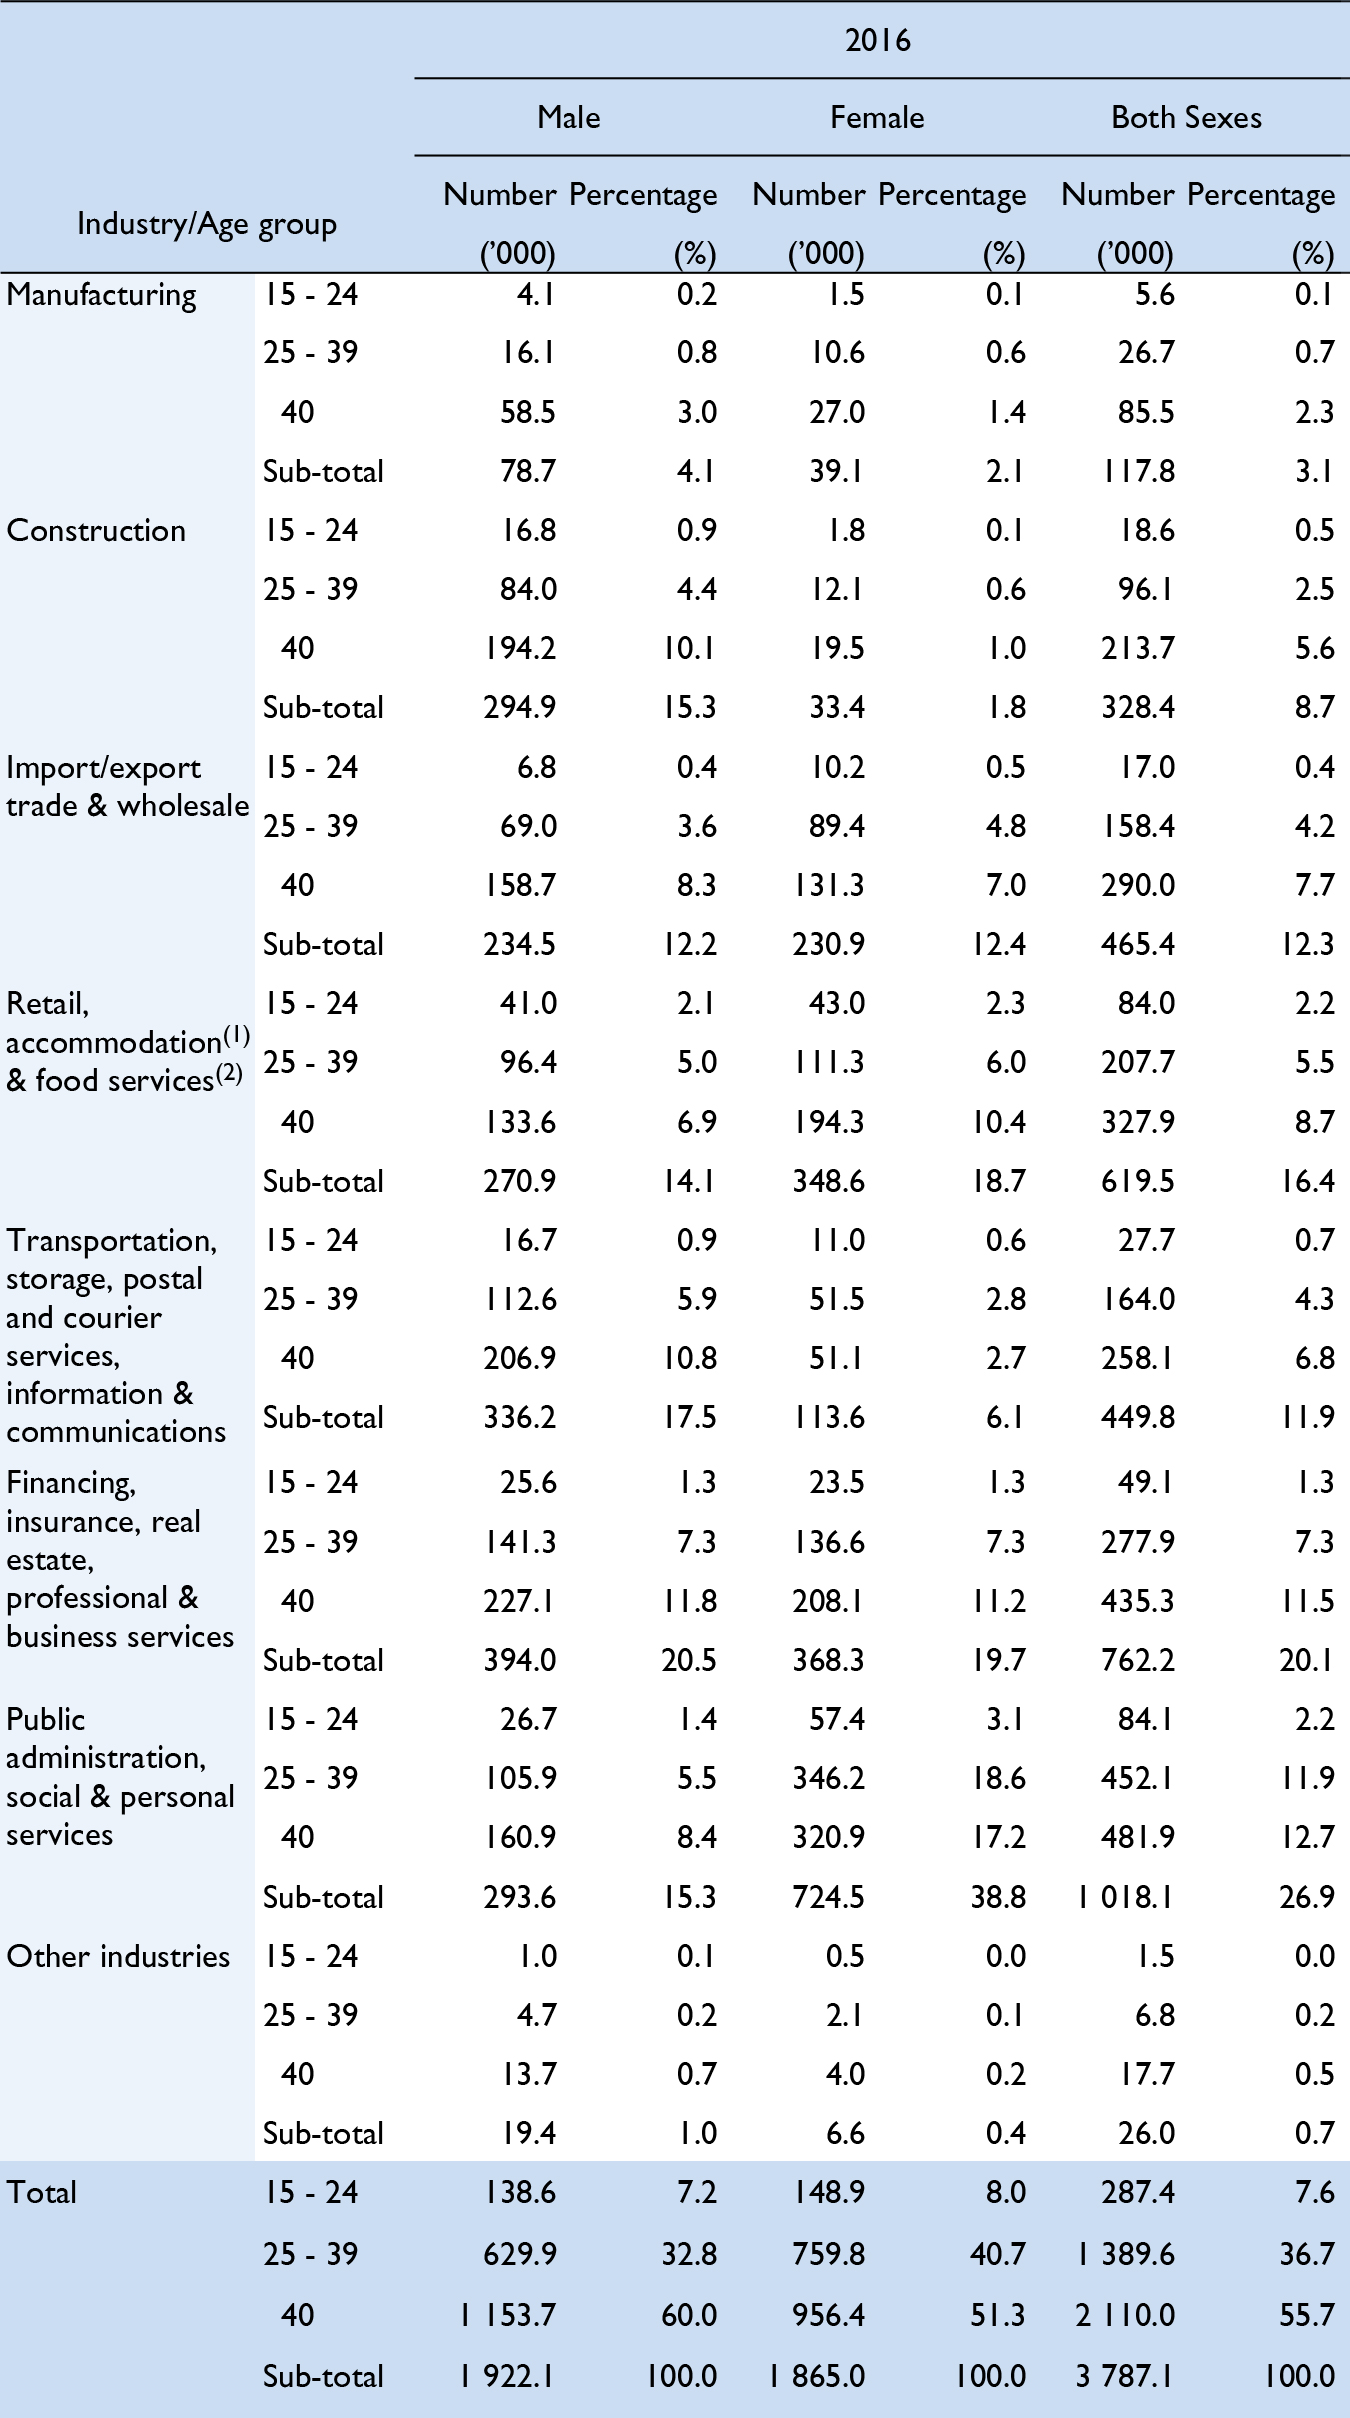
Statistics are compiled based on HSIC Version 2.0.
(1)Accommodation services cover hotels, guesthouses, boarding houses and other establishments providing short term accommodation.
(2) The retail, accommodation and food services industries as a whole are generally referred to as the consumption- and tourism-related segment.
0.0 Means less than 0.05%
Notes:The 2016 Population By-census conducted from June to August 2016 provides a benchmark for revising the population figures compiled since the 2011 Population Census. In the above table, population-related figures from 2012 to 2015 have been revised accordingly.

Note:(1)Figures refer to per capita GDP at current market prices.
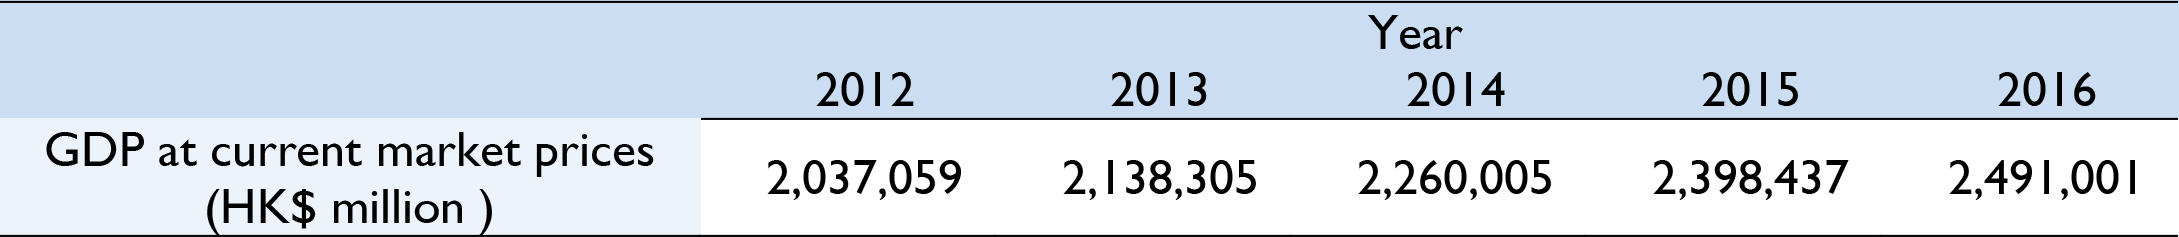

Notes:(1)Figures refer to percentage change of GDP in real terms.
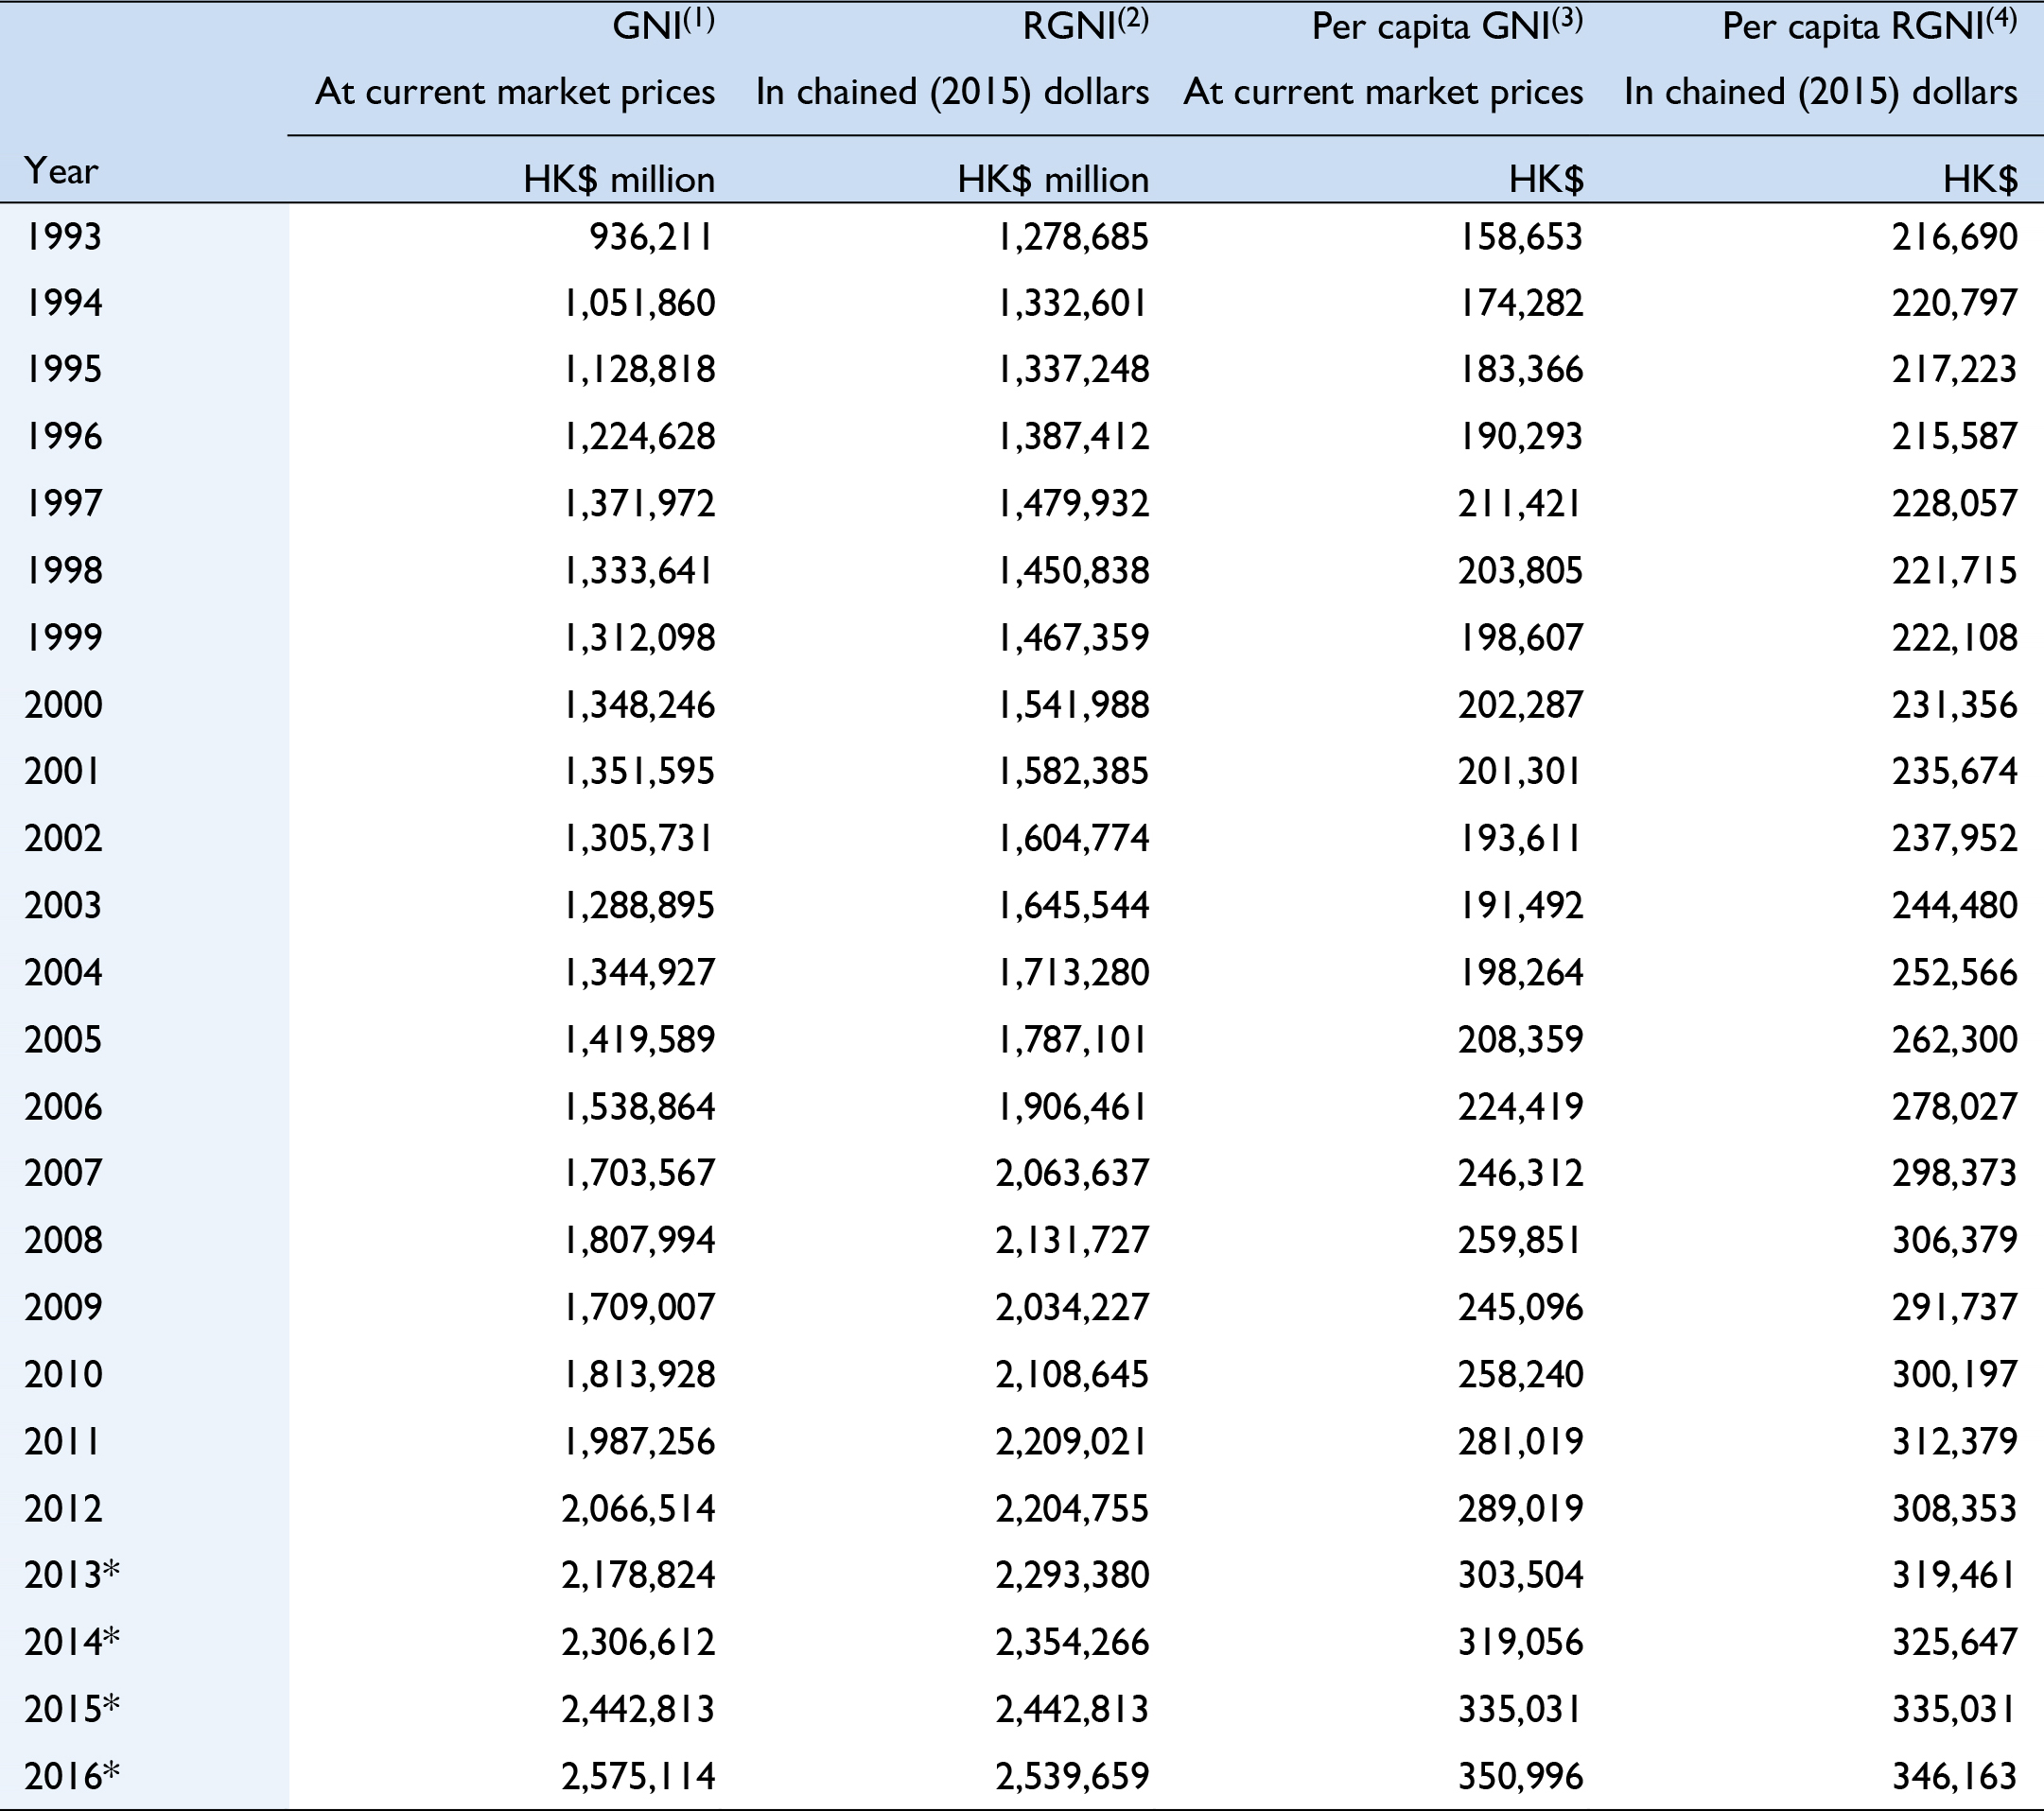
Note:
Figures in this table are the latest data released on 10 November 2017.
In Hong Kong, the first released GNI statistics in respect of a period are called “preliminary figures”. When more data become available, the preliminary figures will be revised. All those figures published subsequently, on revision, are called “revised figures”. The figures are finalised when data from all regular sources are incorporated.
(1) GNI is a measure of the total income earned by residents of an economy from engaging in various economic activities, irrespective of whether the economic activities are carried out within the economic territory of the economy or outside. GNI is computed as follows:
GNI = GDP + Net external primary income flows
Primary income comprises investment income and compensation of employees. Investment income includes direct investment income, portfolio investment income and other investment income as well as income on reserve assets.
(2) The chained dollar estimate of RGNI for a particular year is obtained by multiplying the chain volume index for that year by the current price value for the reference year. In compiling the continuous time series of the chain volume indices of RGNI, the annually re-weighted chain linking approach is adopted.
(3) Per capita GNI of an economy is obtained by dividing GNI in a year by the population of that economy in the same year.
(4) Per capita RGNI of an economy is obtained by dividing RGNI in a year by the population of that economy in the same year.
The 2016 Population By-census conducted from June to August 2016 provides a benchmark for revising the population figures compiled since the 2011 Population Census. In this table, per capita GNI and per capita RGNI figures from 2012 to 2016 have been revised accordingly.
* Revised figures
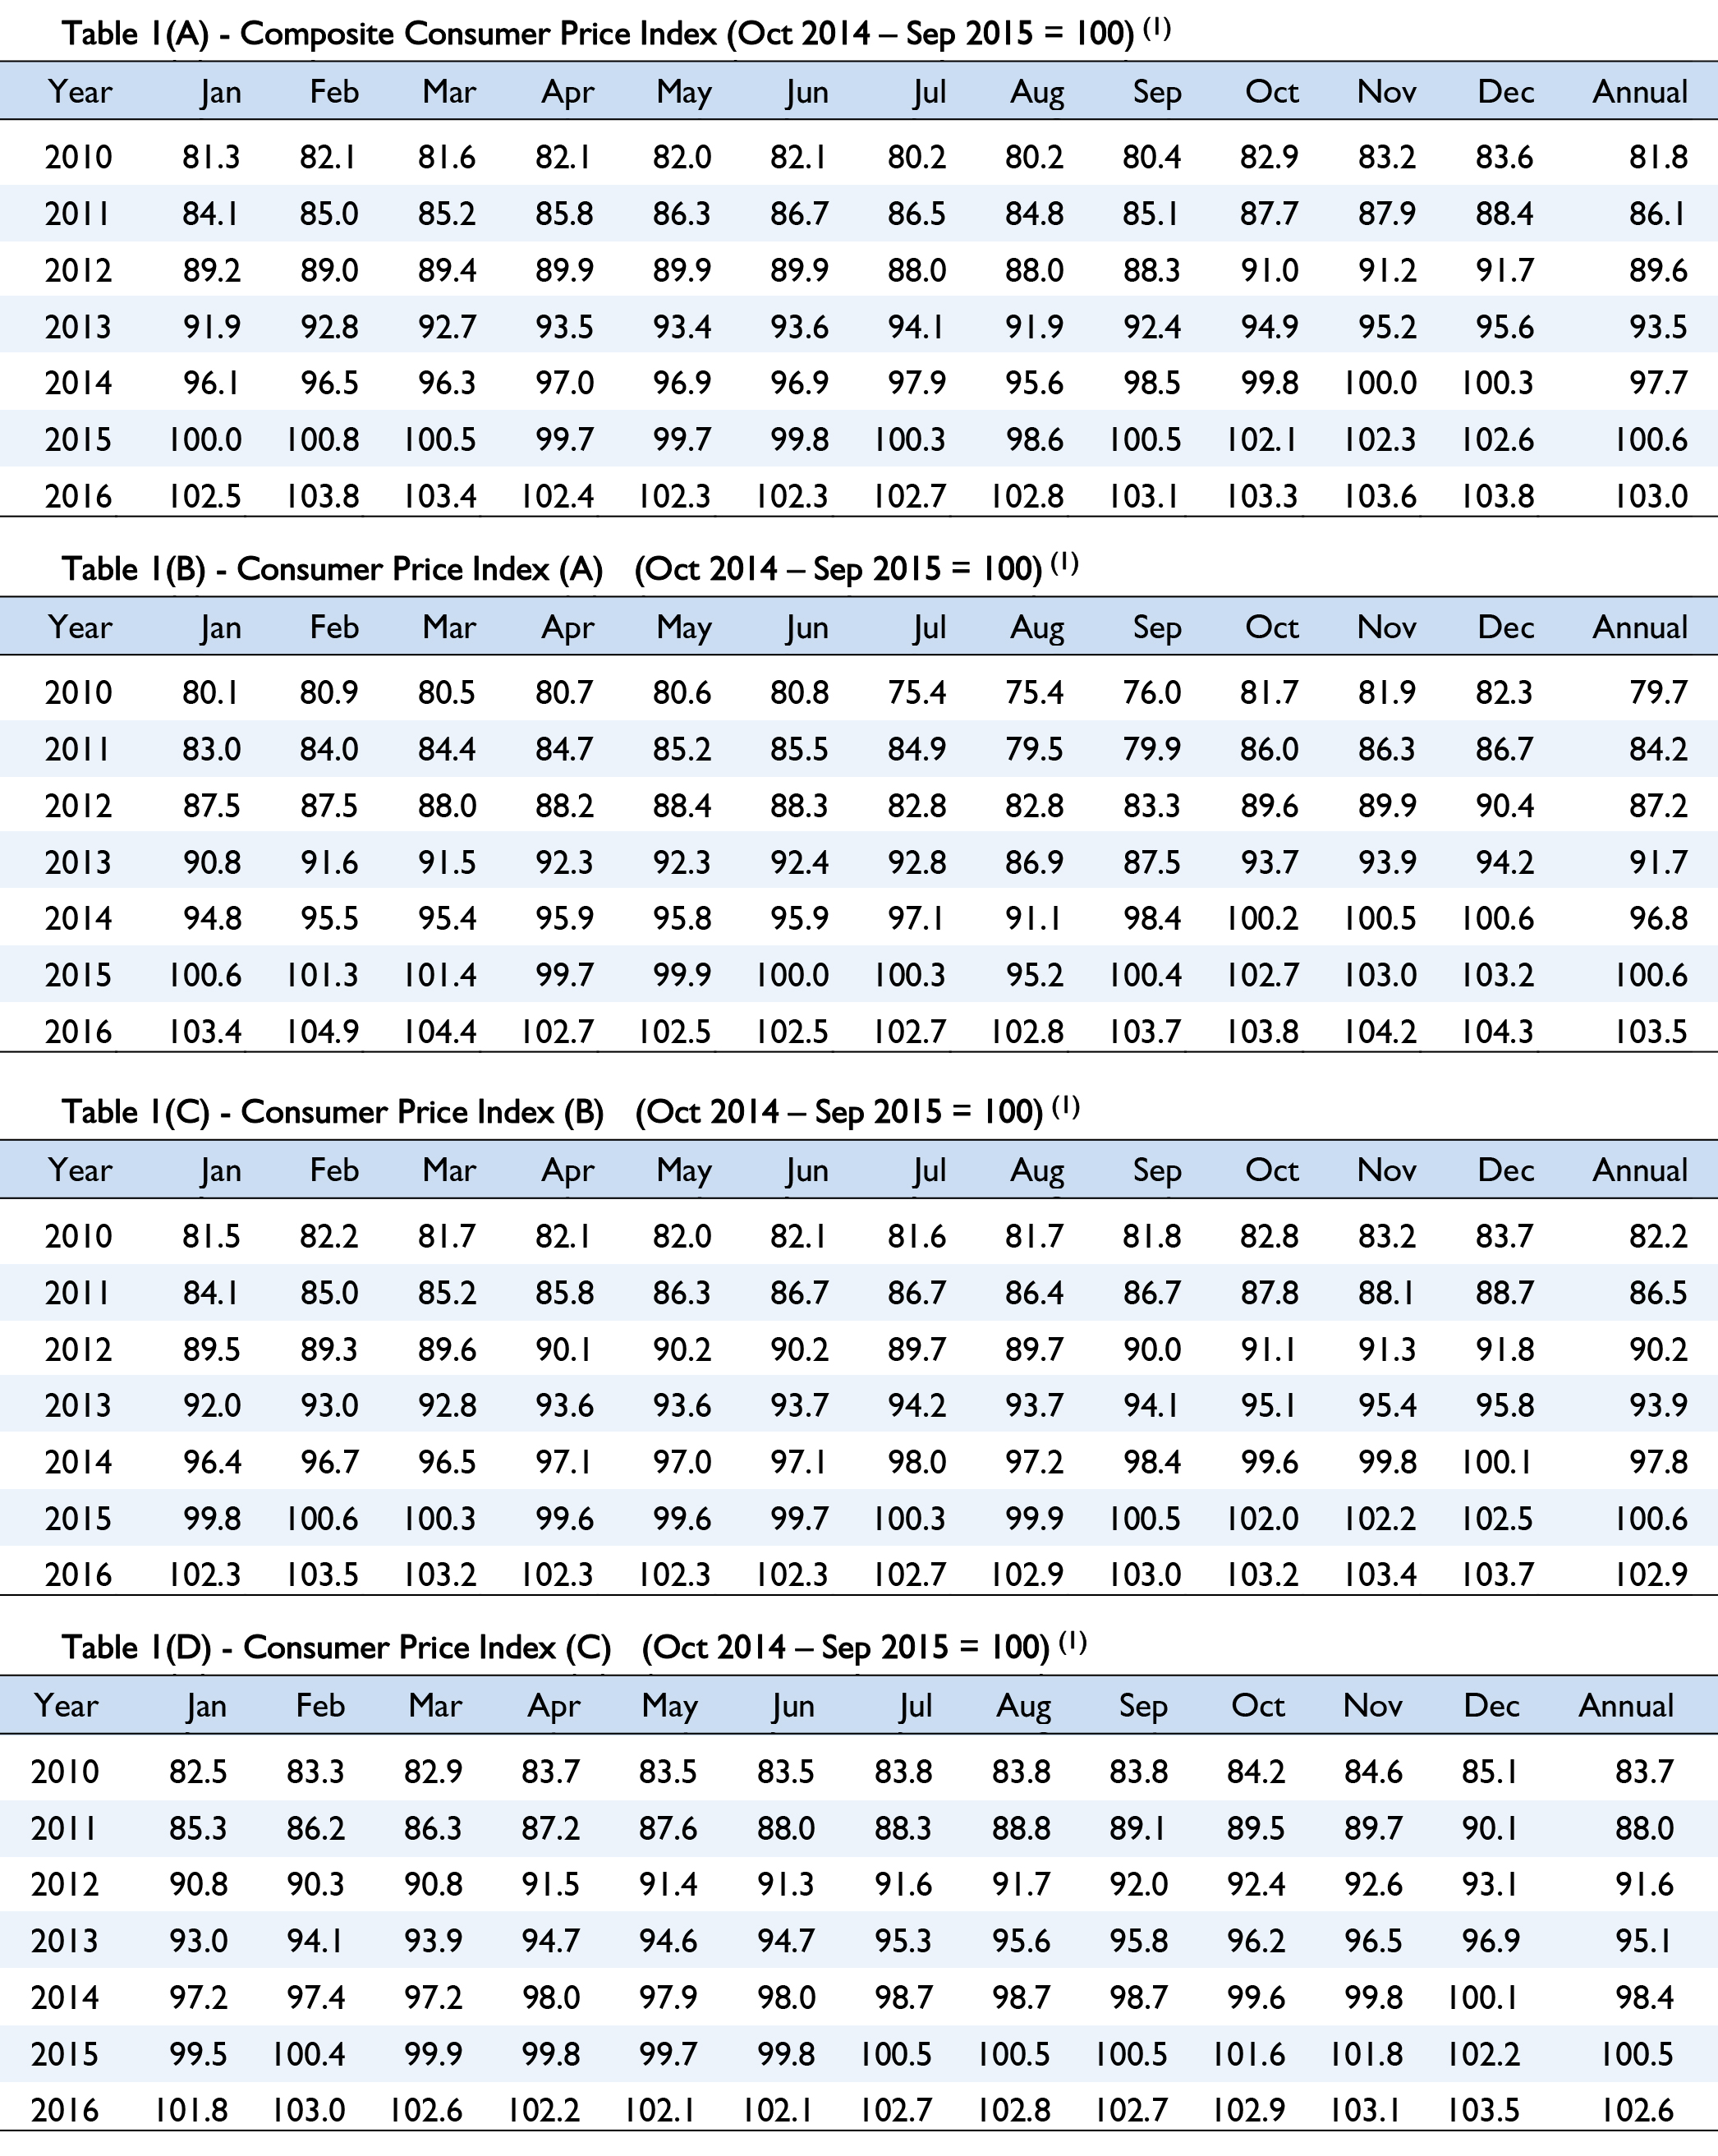
Note:
(1)
The Consumer Price Indices from October 2014 onwards are compiled based on expenditure weights obtained from the 2014/15 Household Expenditure Survey. The Consumer Price Indices for earlier periods are compiled based on old weights and have been re-scaled to the new base period for linking with the new index series.
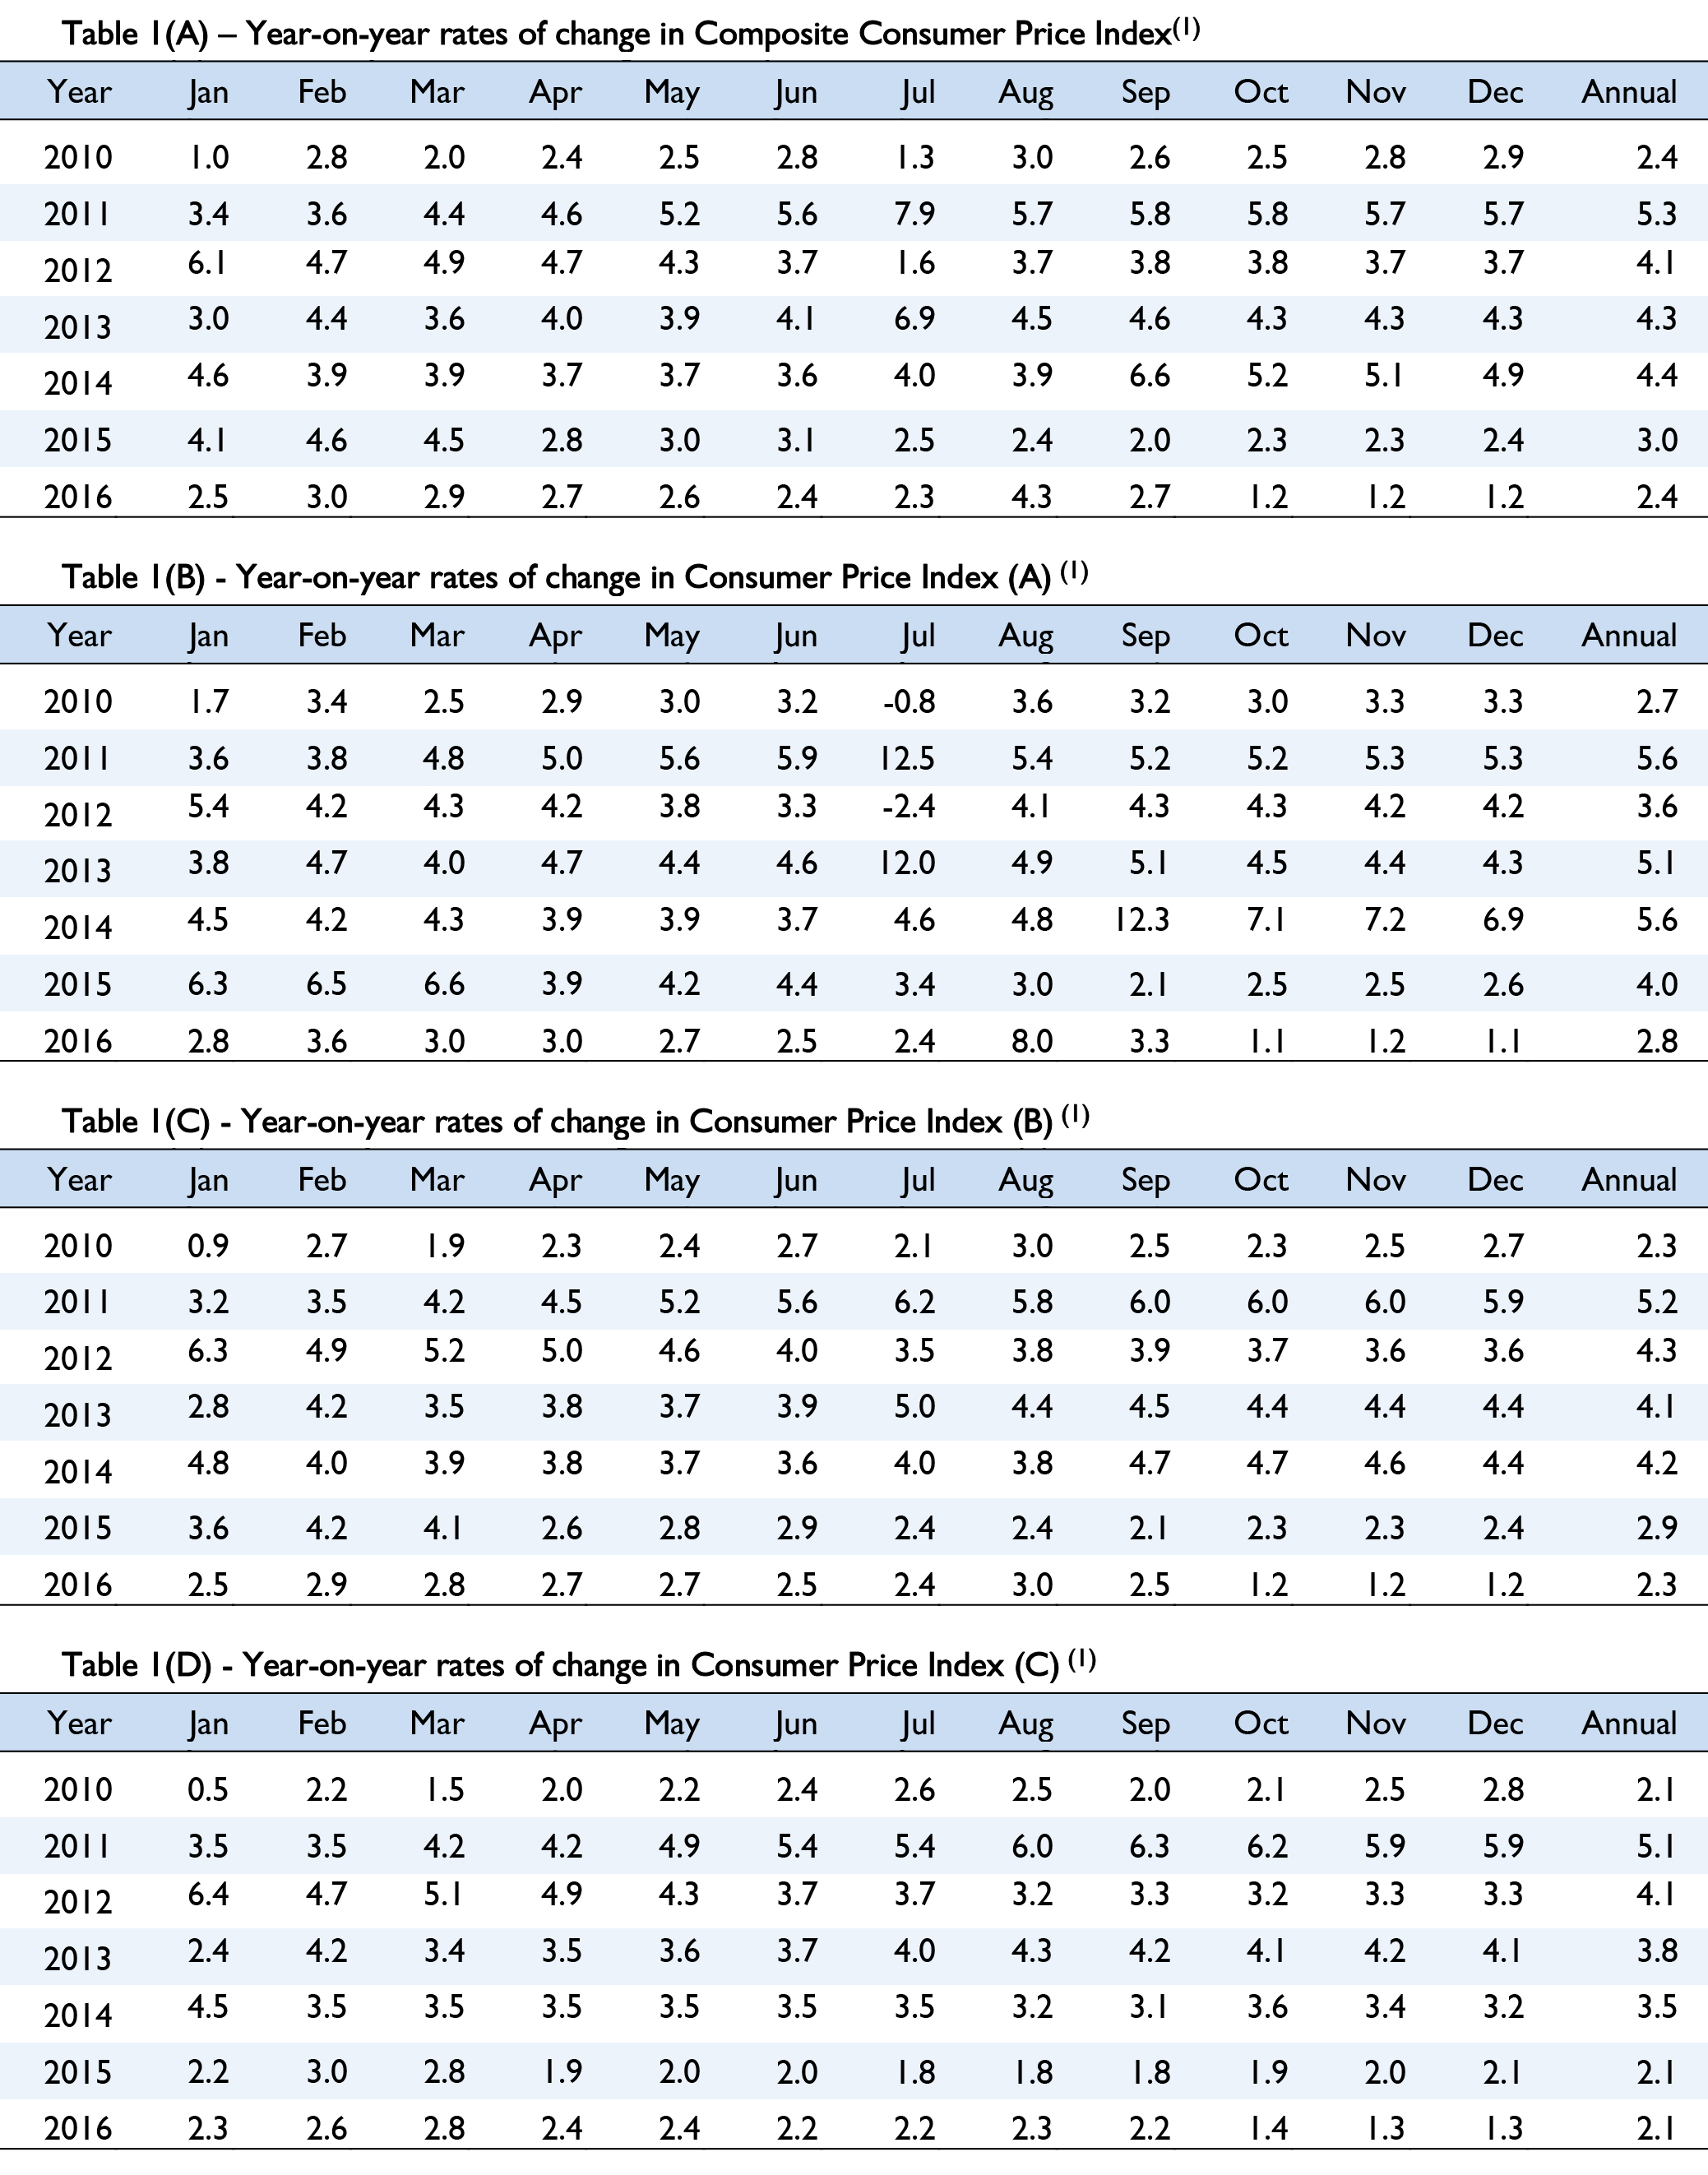
Note:
(1)
From October 2015 onwards, the year-on-year rates of change are derived from the 2014/15-based Consumer Price Indices. The year-on-year rates of change before October 2015 were derived using the index series in the base periods at that time (for instance the 2009/10-based index series), compared with the index a year earlier in the same base period.
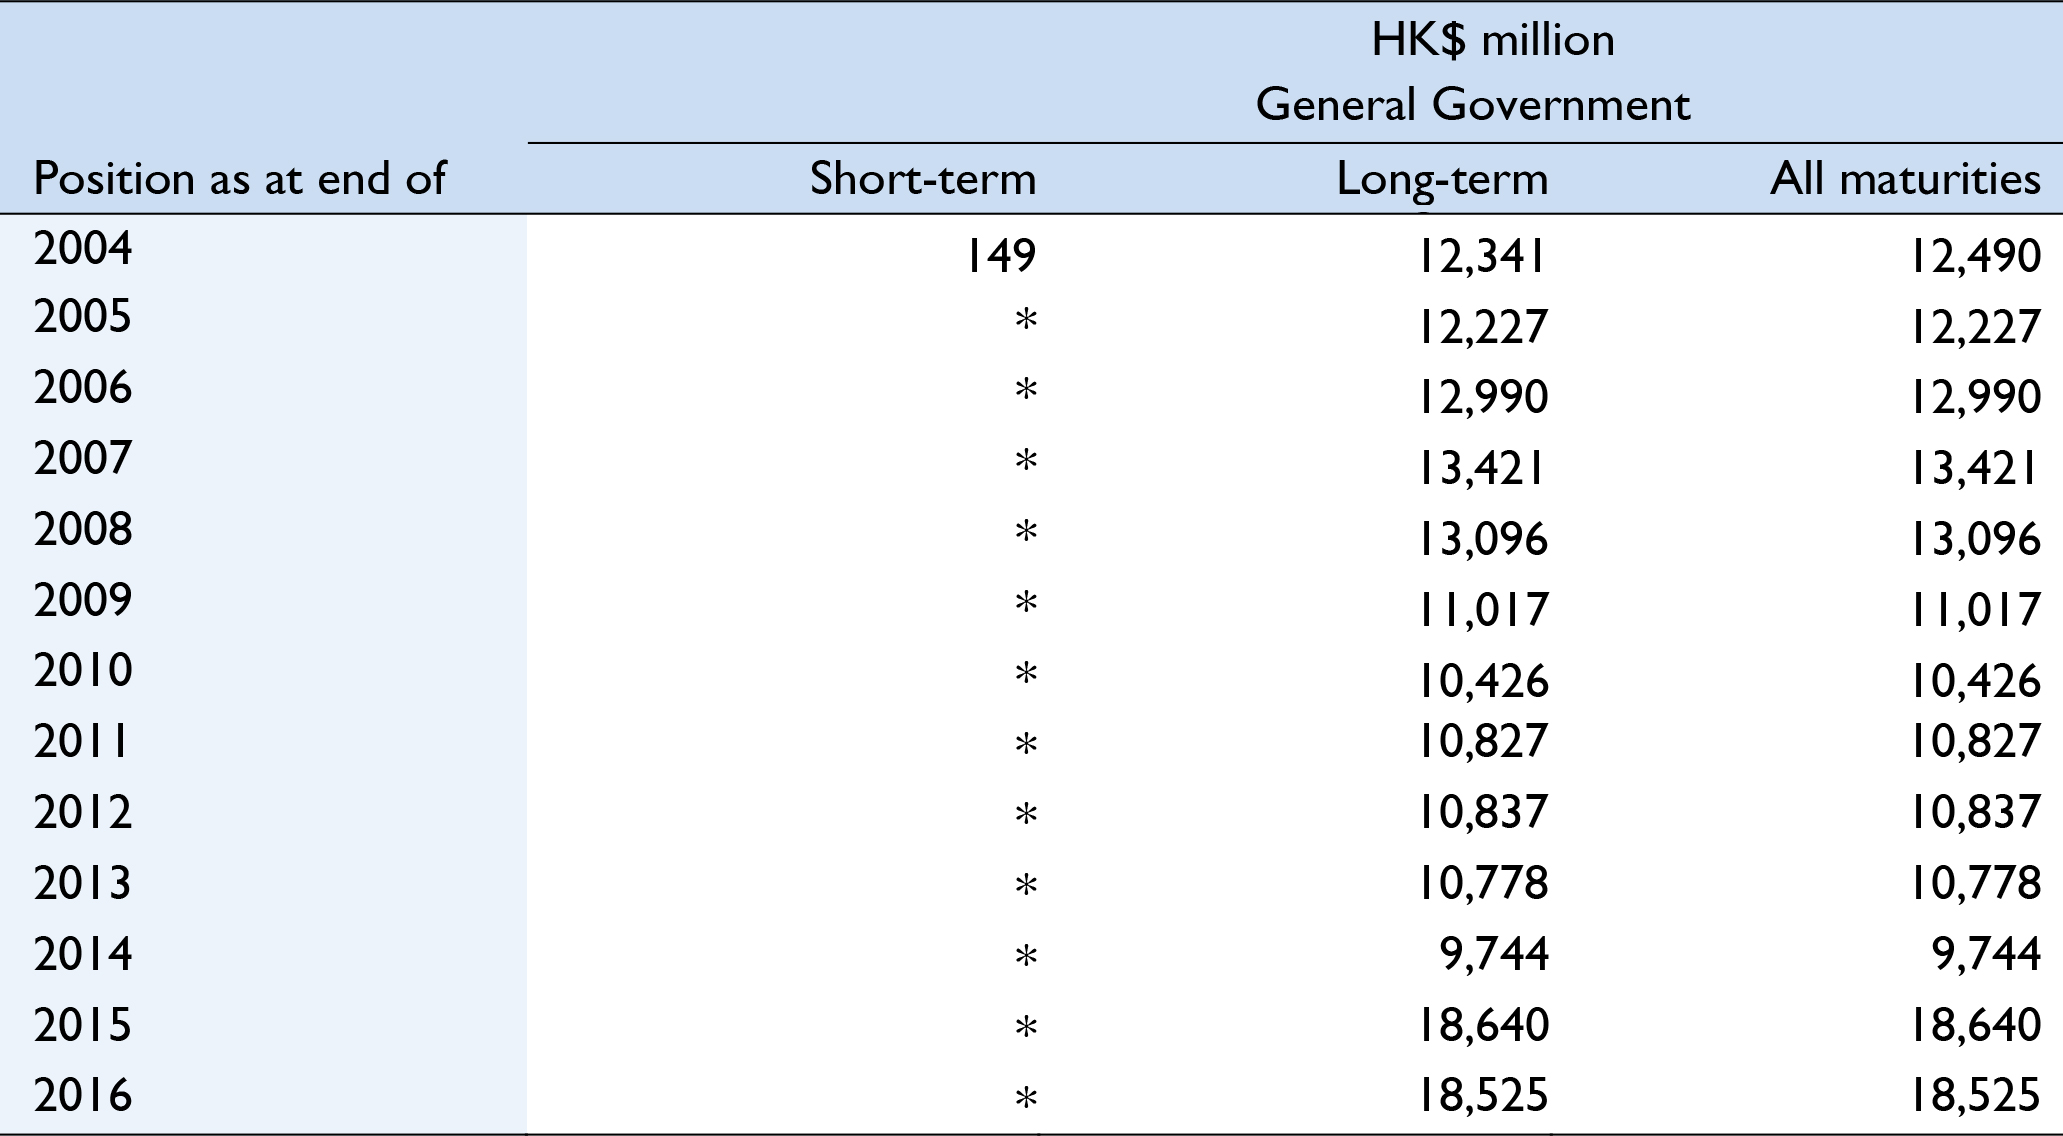
Note: * Data are not released due to relatively insignificant value (less than HK$10 million).